|
Download Data (XLS File) |
|
||||||||
|
||||||||
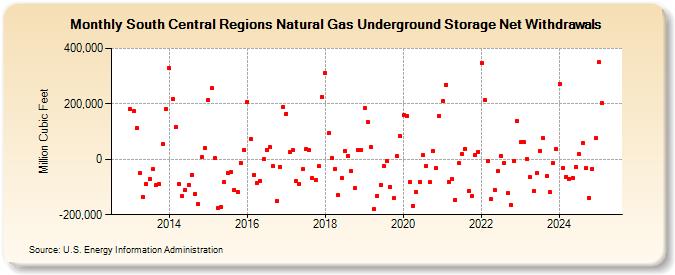
| South Central Regions Natural Gas Underground Storage Net Withdrawals (Million Cubic Feet) | ||||||||
| Year | Jan | Feb | Mar | Apr | May | Jun | Jul | Aug | Sep | Oct | Nov | Dec |
|---|---|---|---|---|---|---|---|---|---|---|---|---|
| 2013 | 180,642 | 173,020 | 113,268 | -51,205 | -136,425 | -90,058 | -72,041 | -36,218 | -93,543 | -90,077 | 56,465 | 180,638 |
| 2014 | 327,547 | 217,408 | 115,000 | -90,131 | -133,863 | -109,928 | -91,771 | -55,342 | -124,657 | -162,037 | 6,651 | 40,026 |
| 2015 | 214,020 | 255,529 | 3,421 | -174,950 | -172,570 | -82,015 | -48,975 | -46,205 | -110,024 | -116,399 | -11,936 | 33,813 |
| 2016 | 207,396 | 73,846 | -55,521 | -85,205 | -79,227 | -212 | 33,529 | 43,149 | -25,428 | -149,809 | -27,405 | 189,436 |
| 2017 | 165,118 | 24,469 | 32,259 | -77,772 | -87,874 | -36,126 | 35,989 | 33,012 | -68,100 | -74,980 | -25,593 | 225,046 |
| 2018 | 310,329 | 93,007 | 3,063 | -34,545 | -129,720 | -66,645 | 31,635 | 11,385 | -43,688 | -105,301 | 33,396 | 34,995 |
| 2019 | 183,717 | 135,322 | 44,452 | -180,876 | -131,547 | -91,845 | -24,774 | -7,468 | -99,737 | -141,494 | 10,792 | 83,417 |
| 2020 | 159,358 | 155,827 | -82,667 | -166,941 | -118,633 | -81,092 | 14,386 | -23,397 | -83,297 | 29,853 | -31,733 | 156,340 |
| 2021 | 211,080 | 269,707 | -80,892 | -71,340 | -145,767 | -15,206 | 20,303 | 36,700 | -114,654 | -132,649 | 15,715 | 27,588 |
| 2022 | 347,924 | 215,528 | -6,997 | -144,381 | -109,585 | -43,784 | 12,890 | -13,552 | -121,155 | -164,208 | -7,622 | 136,617 |
| 2023 | 62,139 | 60,584 | 1,277 | -64,114 | -113,853 | -49,899 | 29,294 | 77,232 | -61,147 | -119,327 | -11,989 | 36,080 |
| 2024 | 270,876 | -30,417 | -62,618 | -69,882 | -65,963 | -28,383 | 17,278 | 57,277 | -33,030 | -138,168 | -33,768 | 75,538 |
| 2025 | 348,081 | 202,908 | -115,852 | -124,413 | -150,158 | -88,181 | 2,411 | 6,360 | -53,628 | -106,706 | -43,331 | 148,074 |
| 2026 | 330,152 | 139,606 | -78,583 | -103,916 | ||||||||
| - = No Data Reported; -- = Not Applicable; NA = Not Available; W = Withheld to avoid disclosure of individual company data. |
| Release Date: 6/30/2026 |
| Next Release Date: 7/31/2026 |