|
Download Data (XLS File) |
|
||||||||
|
||||||||
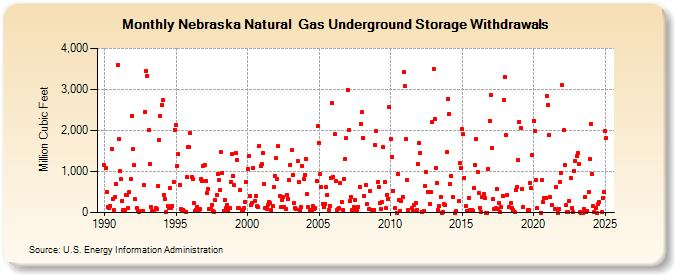
| Nebraska Natural Gas Underground Storage Withdrawals (Million Cubic Feet) | ||||||||
| Year | Jan | Feb | Mar | Apr | May | Jun | Jul | Aug | Sep | Oct | Nov | Dec |
|---|---|---|---|---|---|---|---|---|---|---|---|---|
| 1990 | 1,156 | 1,075 | 503 | 128 | 105 | 166 | 1,555 | 332 | 68 | 391 | 686 | 3,605 |
| 1991 | 1,801 | 1,007 | 810 | 288 | 71 | 69 | 417 | 432 | 123 | 494 | 814 | 2,362 |
| 1992 | 1,540 | 1,149 | 321 | 100 | 28 | 24 | 35 | 32 | 33 | 676 | 2,461 | 3,451 |
| 1993 | 3,338 | 2,006 | 1,180 | 141 | 35 | 39 | 28 | 111 | 75 | 652 | 1,763 | 2,349 |
| 1994 | 2,628 | 2,733 | 439 | 321 | 18 | 148 | 119 | 597 | 104 | 170 | 756 | 2,019 |
| 1995 | 2,145 | 1,146 | 1,424 | 678 | 84 | 55 | 68 | 29 | 23 | 865 | 1,602 | 1,597 |
| 1996 | 1,937 | 855 | 816 | 227 | 33 | 60 | 131 | 70 | 90 | 812 | 768 | 1,133 |
| 1997 | 1,167 | 769 | 475 | 568 | 82 | 82 | 195 | 34 | 24 | 299 | 425 | 950 |
| 1998 | 787 | 559 | 1,474 | 962 | 40 | 316 | 101 | 195 | 27 | 101 | 747 | 1,420 |
| 1999 | 900 | 662 | 1,449 | 1,287 | 103 | 109 | 557 | 59 | 28 | 110 | 260 | 751 |
| 2000 | 1,066 | 1,367 | 411 | 195 | 244 | 1,096 | 292 | 412 | 164 | 126 | 1,627 | 1,130 |
| 2001 | 1,186 | 1,456 | 706 | 100 | 77 | 179 | 258 | 222 | 67 | 171 | 632 | 899 |
| 2002 | 1,320 | 827 | 1,613 | 396 | 146 | 294 | 371 | 127 | 77 | 417 | 342 | 787 |
| 2003 | 1,170 | 1,530 | 920 | 229 | 111 | 93 | 1,245 | 735 | 61 | 126 | 1,141 | 828 |
| 2004 | 927 | 1,317 | 457 | 141 | 40 | 68 | 51 | 157 | 83 | 105 | 768 | 2,099 |
| 2005 | 1,692 | 944 | 622 | 219 | 129 | 200 | 616 | 440 | 73 | 172 | 837 | 2,663 |
| 2006 | 875 | 1,907 | 763 | 63 | 78 | 109 | 709 | 252 | 72 | 822 | 1,293 | 1,816 |
| 2007 | 2,995 | 2,013 | 283 | 369 | 55 | 125 | 296 | 69 | 37 | 144 | 626 | 2,159 |
| 2008 | 2,438 | 1,825 | 411 | 682 | 201 | 97 | 519 | 62 | 66 | 67 | 1,653 | |
| 2009 | 1,981 | 735 | 628 | 238 | 89 | 246 | 1,594 | 743 | 109 | 438 | 325 | 2,563 |
| 2010 | 1,797 | 1,365 | 532 | 119 | 0 | 938 | 311 | 48 | 270 | 387 | 3,421 | |
| 2011 | 3,076 | 1,791 | 799 | 72 | 106 | 44 | 182 | 236 | 69 | 1,181 | ||
| 2012 | 1,699 | 1,442 | 20 | 29 | 656 | 986 | 510 | 205 | 496 | 2,204 | ||
| 2013 | 3,501 | 2,280 | 1,089 | 720 | 51 | 150 | 371 | 0 | 3 | 204 | 179 | 1,469 |
| 2014 | 2,758 | 2,400 | 702 | 879 | 381 | 0 | 26 | 280 | 1,199 | 1,096 | ||
| 2015 | 2,027 | 1,906 | 850 | 152 | 40 | 365 | 72 | 58 | 37 | 598 | 1,167 | |
| 2016 | 1,788 | 991 | 486 | 111 | 9 | 387 | 454 | 360 | 0 | 0 | 1,063 | 2,237 |
| 2017 | 2,859 | 1,562 | 326 | 82 | 103 | 570 | 84 | 225 | 13 | 127 | 410 | 2,753 |
| 2018 | 3,298 | 1,884 | 428 | 136 | 224 | 102 | 59 | 2 | 552 | 629 | 1,281 | |
| 2019 | 2,218 | 2,061 | 565 | 128 | 52 | 57 | 714 | 608 | 1,391 | |||
| 2020 | 2,242 | 1,976 | 787 | 101 | 1 | 786 | 247 | 345 | 350 | 2,851 | ||
| 2021 | 2,631 | 1,895 | 368 | 187 | 83 | 613 | 1 | 94 | 748 | 958 | ||
| 2022 | 3,102 | 2,000 | 1,154 | 174 | 11 | 12 | 270 | 845 | 99 | 13 | 1,014 | 1,268 |
| 2023 | 1,368 | 1,459 | 1,186 | 6 | 0 | 0 | 97 | 375 | 4 | 46 | 499 | 1,306 |
| 2024 | 2,158 | 935 | 169 | 4 | 112 | 1 | 202 | 254 | 16 | 365 | 497 | |
| 2025 | 1,979 | 1,811 | 218 | 1 | 0 | 2 | 323 | 34 | 70 | 78 | 229 | |
| 2026 | 1,869 | 908 | 65 | 54 | ||||||||
| - = No Data Reported; -- = Not Applicable; NA = Not Available; W = Withheld to avoid disclosure of individual company data. |
| Release Date: 6/30/2026 |
| Next Release Date: 7/31/2026 |