|
Download Data (XLS File) |
|
||||||||
|
||||||||
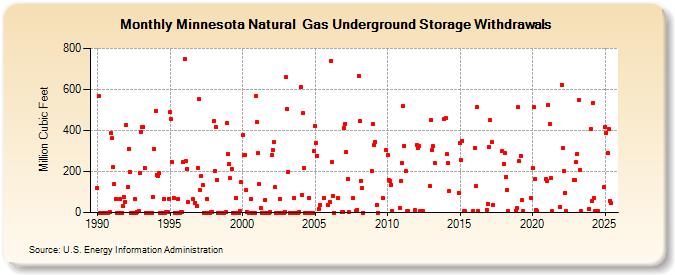
| Minnesota Natural Gas Underground Storage Withdrawals (Million Cubic Feet) | ||||||||
| Year | Jan | Feb | Mar | Apr | May | Jun | Jul | Aug | Sep | Oct | Nov | Dec |
|---|---|---|---|---|---|---|---|---|---|---|---|---|
| 1990 | 120 | 567 | 0 | 0 | 0 | 0 | 0 | 0 | 0 | 0 | 3 | 387 |
| 1991 | 361 | 223 | 138 | 68 | 0 | 0 | 0 | 65 | 0 | 32 | 77 | 53 |
| 1992 | 426 | 123 | 311 | 198 | 0 | 0 | 0 | 66 | 0 | 4 | 7 | 193 |
| 1993 | 395 | 417 | 417 | 219 | 0 | 0 | 0 | 0 | 0 | 0 | 75 | 310 |
| 1994 | 497 | 184 | 180 | 191 | 0 | 0 | 0 | 66 | 0 | 2 | 3 | 68 |
| 1995 | 491 | 456 | 246 | 71 | 0 | 0 | 0 | 67 | 0 | 3 | 2 | 245 |
| 1996 | 748 | 250 | 213 | 52 | - | - | - | 67 | - | 48 | 30 | 218 |
| 1997 | 551 | 109 | 177 | 134 | 0 | 0 | 0 | 66 | 0 | 0 | 4 | 4 |
| 1998 | 444 | 203 | 416 | 159 | 0 | 0 | 0 | 0 | 0 | 0 | 2 | 438 |
| 1999 | 287 | 238 | 167 | 214 | 0 | 0 | 0 | 70 | 0 | 0 | 7 | 147 |
| 2000 | 376 | 280 | 282 | 109 | 2 | 0 | 0 | 65 | 0 | 0 | 0 | 567 |
| 2001 | 440 | 291 | 139 | 21 | 0 | 0 | 0 | 63 | 0 | 0 | 0 | 3 |
| 2002 | 279 | 305 | 344 | 123 | 0 | 0 | 0 | 64 | 0 | 0 | 0 | 5 |
| 2003 | 659 | 504 | 199 | 0 | 0 | 0 | 0 | 70 | 0 | 0 | 0 | 4 |
| 2004 | 612 | 88 | 484 | 215 | 0 | 0 | 0 | 70 | 0 | 0 | 0 | 299 |
| 2005 | 422 | 340 | 278 | 18 | 36 | 70 | 38 | |||||
| 2006 | 52 | 740 | 244 | 81 | 0 | 70 | 1 | 5 | ||||
| 2007 | 412 | 432 | 293 | 165 | 1 | 70 | 7 | 14 | ||||
| 2008 | 666 | 446 | 155 | 120 | 0 | 204 | ||||||
| 2009 | 431 | 331 | 346 | 39 | 0 | 70 | 306 | |||||
| 2010 | 279 | 158 | 154 | 135 | 6 | 24 | 155 | |||||
| 2011 | 242 | 518 | 326 | 201 | 6 | 6 | 11 | |||||
| 2012 | 330 | 314 | 322 | 6 | 6 | 6 | 130 | |||||
| 2013 | 453 | 307 | 322 | 243 | 455 | |||||||
| 2014 | 461 | 284 | 240 | 104 | 97 | |||||||
| 2015 | 337 | 255 | 351 | 6 | 6 | 10 | ||||||
| 2016 | 315 | 127 | 515 | 7 | 14 | 44 | ||||||
| 2017 | 321 | 450 | 342 | 36 | 298 | |||||||
| 2018 | 238 | 290 | 175 | 112 | 6 | 10 | 22 | |||||
| 2019 | 512 | 250 | 277 | 59 | 6 | 70 | ||||||
| 2020 | 216 | 512 | 164 | 14 | 6 | 163 | ||||||
| 2021 | 155 | 526 | 430 | 169 | 6 | 28 | ||||||
| 2022 | 623 | 317 | 204 | 97 | 6 | 157 | 157 | |||||
| 2023 | 244 | 286 | 549 | 207 | 6 | 17 | ||||||
| 2024 | 408 | 58 | 536 | 72 | 6 | 6 | 6 | 124 | ||||
| 2025 | 415 | 388 | 292 | 408 | 58 | 45 | 312 | |||||
| 2026 | 555 | 252 | 454 | 172 | ||||||||
| - = No Data Reported; -- = Not Applicable; NA = Not Available; W = Withheld to avoid disclosure of individual company data. |
| Release Date: 6/30/2026 |
| Next Release Date: 7/31/2026 |