|
Download Data (XLS File) |
|
||||||||
|
||||||||
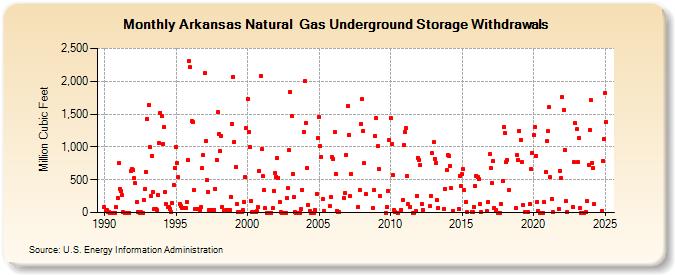
| Arkansas Natural Gas Underground Storage Withdrawals (Million Cubic Feet) | ||||||||
| Year | Jan | Feb | Mar | Apr | May | Jun | Jul | Aug | Sep | Oct | Nov | Dec |
|---|---|---|---|---|---|---|---|---|---|---|---|---|
| 1990 | 84 | 31 | 38 | 10 | 4 | 0 | 0 | 0 | 0 | 0 | 79 | 227 |
| 1991 | 762 | 366 | 321 | 267 | 1 | 0 | 0 | 0 | 0 | 0 | 629 | 664 |
| 1992 | 652 | 519 | 443 | 159 | 16 | 1 | 0 | 1 | 0 | 196 | 366 | 624 |
| 1993 | 1,428 | 1,638 | 991 | 259 | 865 | 308 | 56 | 61 | 35 | 262 | 1,055 | 1,520 |
| 1994 | 1,468 | 1,041 | 1,303 | 310 | 127 | 87 | 85 | 55 | 4 | 143 | 423 | 685 |
| 1995 | 1,005 | 753 | 539 | 130 | 96 | 71 | 73 | 71 | 73 | 162 | 800 | 2,304 |
| 1996 | 2,210 | 1,396 | 1,375 | 351 | 54 | 51 | 51 | 49 | 46 | 87 | 672 | 874 |
| 1997 | 2,122 | 1,088 | 490 | 316 | 44 | 34 | 37 | 44 | 43 | 364 | 807 | 1,526 |
| 1998 | 1,195 | 940 | 1,170 | 85 | 28 | 28 | 36 | 35 | 32 | 37 | 238 | 1,354 |
| 1999 | 2,066 | 1,080 | 690 | 125 | 8 | 6 | 6 | 5 | 35 | 166 | 537 | 1,293 |
| 2000 | 1,733 | 1,228 | 1,003 | 177 | 15 | 8 | 3 | 4 | 18 | 78 | 633 | 2,077 |
| 2001 | 967 | 552 | 343 | 68 | 0 | 0 | 0 | 0 | 0 | 62 | 334 | 606 |
| 2002 | 543 | 838 | 528 | 162 | 2 | 0 | 0 | 0 | 0 | 222 | 367 | 947 |
| 2003 | 1,838 | 1,464 | 587 | 238 | 2 | 0 | 0 | 0 | 0 | 47 | 348 | 1,233 |
| 2004 | 2,002 | 1,365 | 680 | 117 | 20 | 0 | 0 | 0 | 0 | 36 | 289 | 1,132 |
| 2005 | 1,454 | 1,010 | 846 | 200 | 25 | 94 | 232 | 846 | ||||
| 2006 | 813 | 1,225 | 593 | 29 | 5 | 5 | 222 | 305 | 884 | |||
| 2007 | 1,622 | 1,180 | 246 | 593 | 88 | 345 | 1,345 | |||||
| 2008 | 1,727 | 1,242 | 749 | 279 | 73 | 343 | 1,173 | |||||
| 2009 | 1,436 | 1,013 | 661 | 245 | 0 | 79 | 326 | 1,108 | ||||
| 2010 | 1,437 | 1,044 | 571 | 43 | 5 | 0 | 45 | 195 | 1,029 | |||
| 2011 | 1,232 | 1,284 | 559 | 124 | 92 | 0 | 0 | 23 | 259 | 837 | ||
| 2012 | 807 | 724 | 137 | 41 | 95 | 256 | 900 | |||||
| 2013 | 1,067 | 816 | 754 | 184 | 73 | 61 | 365 | 644 | ||||
| 2014 | 869 | 866 | 713 | 367 | 31 | 59 | 563 | 397 | ||||
| 2015 | 584 | 657 | 336 | 168 | 5 | 9 | 12 | 89 | 411 | |||
| 2016 | 562 | 537 | 506 | 130 | 7 | 18 | 165 | 886 | ||||
| 2017 | 677 | 443 | 788 | 72 | 33 | 0 | 0 | 136 | 485 | 1,297 | ||
| 2018 | 1,205 | 765 | 800 | 338 | 70 | 869 | 805 | |||||
| 2019 | 1,242 | 1,105 | 770 | 118 | 5 | 2 | 123 | 664 | 913 | |||
| 2020 | 1,181 | 1,307 | 867 | 167 | 27 | 0 | 0 | 0 | 159 | 624 | 1,086 | |
| 2021 | 1,235 | 1,601 | 536 | 209 | 4 | 51 | 636 | 525 | ||||
| 2022 | 1,755 | 1,565 | 952 | 174 | 3 | 86 | 766 | 1,357 | ||||
| 2023 | 1,268 | 770 | 1,135 | 65 | 0 | 0 | 1 | 175 | 727 | 1,264 | ||
| 2024 | 1,709 | 761 | 678 | 123 | 27 | 784 | 1,121 | |||||
| 2025 | 1,821 | 1,377 | 737 | 113 | 60 | 661 | 1,269 | |||||
| 2026 | 1,711 | 915 | 467 | 2 | ||||||||
| - = No Data Reported; -- = Not Applicable; NA = Not Available; W = Withheld to avoid disclosure of individual company data. |
| Release Date: 6/30/2026 |
| Next Release Date: 7/31/2026 |