|
Download Data (XLS File) |
|
||||||||
|
||||||||
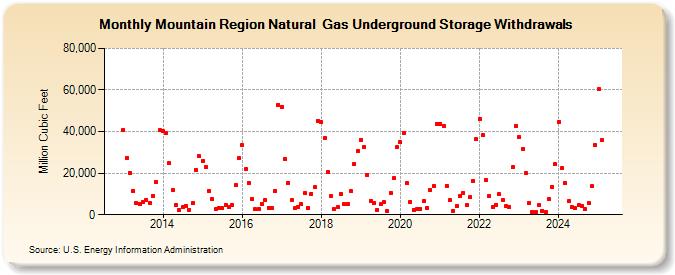
| Mountain Region Natural Gas Underground Storage Withdrawals (Million Cubic Feet) | ||||||||
| Year | Jan | Feb | Mar | Apr | May | Jun | Jul | Aug | Sep | Oct | Nov | Dec |
|---|---|---|---|---|---|---|---|---|---|---|---|---|
| 2013 | 40,840 | 27,459 | 20,265 | 11,539 | 5,510 | 5,347 | 6,325 | 7,238 | 5,651 | 9,049 | 15,719 | 40,625 |
| 2014 | 40,219 | 39,113 | 24,726 | 11,714 | 4,654 | 2,208 | 3,583 | 4,296 | 2,414 | 5,486 | 21,524 | 28,060 |
| 2015 | 25,748 | 22,793 | 11,588 | 7,438 | 2,619 | 3,047 | 3,190 | 4,707 | 3,878 | 4,817 | 14,131 | 27,138 |
| 2016 | 33,468 | 21,849 | 15,279 | 7,497 | 2,602 | 2,741 | 5,370 | 7,057 | 3,410 | 3,025 | 11,577 | 52,997 |
| 2017 | 51,935 | 26,737 | 15,457 | 6,904 | 3,060 | 3,834 | 5,024 | 10,370 | 3,438 | 10,094 | 13,204 | 45,276 |
| 2018 | 44,489 | 36,787 | 20,387 | 8,803 | 2,771 | 3,508 | 9,862 | 4,996 | 5,205 | 11,212 | 24,406 | 30,457 |
| 2019 | 35,989 | 32,611 | 19,288 | 6,761 | 5,562 | 2,359 | 4,958 | 5,937 | 1,730 | 10,553 | 17,484 | 32,487 |
| 2020 | 34,746 | 39,383 | 15,123 | 6,165 | 2,445 | 2,627 | 2,828 | 6,409 | 3,307 | 11,908 | 13,793 | 43,722 |
| 2021 | 43,838 | 42,733 | 14,031 | 6,905 | 2,019 | 4,212 | 8,916 | 10,601 | 4,761 | 8,406 | 16,159 | 36,213 |
| 2022 | 46,223 | 38,110 | 16,695 | 8,935 | 3,797 | 4,726 | 9,795 | 7,283 | 4,067 | 3,720 | 22,745 | 42,594 |
| 2023 | 37,328 | 31,643 | 19,856 | 5,669 | 1,340 | 1,152 | 4,551 | 1,974 | 1,515 | 7,351 | 13,525 | 24,164 |
| 2024 | 44,805 | 22,234 | 15,175 | 6,527 | 3,546 | 3,002 | 4,440 | 4,080 | 2,574 | 5,608 | 13,668 | 33,403 |
| 2025 | 60,334 | 35,698 | 13,621 | 8,935 | 3,871 | 3,293 | 5,137 | 8,869 | 3,515 | 5,316 | 15,465 | 31,729 |
| 2026 | 49,303 | 22,400 | 9,587 | 12,155 | ||||||||
| - = No Data Reported; -- = Not Applicable; NA = Not Available; W = Withheld to avoid disclosure of individual company data. |
| Release Date: 6/30/2026 |
| Next Release Date: 7/31/2026 |