|
Download Data (XLS File) |
|
||||||||
|
||||||||
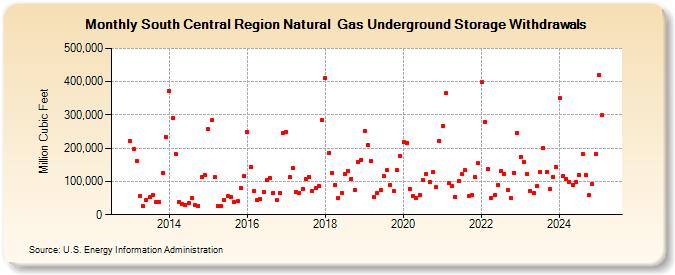
| South Central Region Natural Gas Underground Storage Withdrawals (Million Cubic Feet) | ||||||||
| Year | Jan | Feb | Mar | Apr | May | Jun | Jul | Aug | Sep | Oct | Nov | Dec |
|---|---|---|---|---|---|---|---|---|---|---|---|---|
| 2013 | 221,333 | 197,584 | 161,766 | 54,806 | 25,993 | 43,681 | 52,890 | 60,514 | 38,770 | 37,489 | 126,479 | 233,495 |
| 2014 | 371,260 | 289,618 | 183,273 | 39,605 | 32,953 | 29,651 | 35,762 | 50,673 | 28,279 | 26,329 | 112,590 | 119,365 |
| 2015 | 256,423 | 283,344 | 112,986 | 27,466 | 25,868 | 43,144 | 55,057 | 51,969 | 37,838 | 41,062 | 79,913 | 115,758 |
| 2016 | 247,173 | 142,744 | 72,667 | 44,724 | 47,250 | 68,864 | 104,541 | 109,699 | 65,719 | 43,830 | 66,462 | 246,330 |
| 2017 | 249,625 | 112,407 | 139,718 | 69,544 | 66,048 | 76,982 | 108,244 | 113,024 | 71,817 | 79,813 | 86,205 | 285,395 |
| 2018 | 411,406 | 186,404 | 125,133 | 90,415 | 49,584 | 65,012 | 122,355 | 131,048 | 108,293 | 74,744 | 158,478 | 165,307 |
| 2019 | 252,778 | 209,538 | 161,422 | 52,933 | 64,208 | 73,604 | 115,125 | 133,678 | 90,475 | 69,911 | 133,096 | 177,730 |
| 2020 | 217,787 | 216,921 | 77,768 | 55,880 | 51,719 | 60,433 | 103,971 | 122,551 | 98,186 | 128,490 | 81,969 | 222,264 |
| 2021 | 267,523 | 364,752 | 93,911 | 86,946 | 53,176 | 102,755 | 121,153 | 132,925 | 55,531 | 58,120 | 113,194 | 154,153 |
| 2022 | 398,127 | 279,891 | 136,357 | 51,036 | 59,544 | 88,562 | 131,874 | 122,477 | 75,760 | 50,708 | 126,773 | 246,816 |
| 2023 | 174,429 | 157,928 | 123,820 | 72,190 | 63,894 | 85,708 | 129,471 | 200,346 | 130,874 | 76,595 | 114,792 | 142,784 |
| 2024 | 350,133 | 116,512 | 107,078 | 97,995 | 90,816 | 98,554 | 119,789 | 182,868 | 120,546 | 58,897 | 91,863 | 182,015 |
| 2025 | 417,993 | 299,570 | 97,054 | 77,099 | 58,675 | 76,303 | 129,134 | 126,200 | 86,052 | 72,432 | 92,234 | 258,521 |
| 2026 | 403,778 | 240,840 | 105,472 | 81,467 | ||||||||
| - = No Data Reported; -- = Not Applicable; NA = Not Available; W = Withheld to avoid disclosure of individual company data. |
| Release Date: 6/30/2026 |
| Next Release Date: 7/31/2026 |