|
Download Data (XLS File) |
|
||||||||
|
||||||||
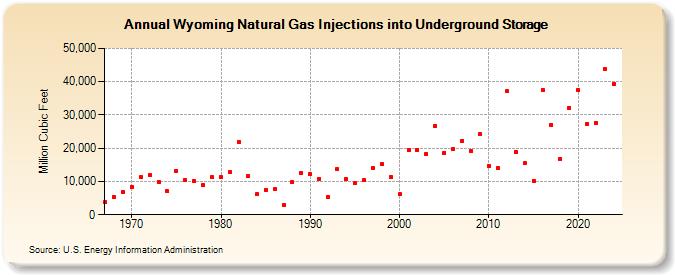
| Wyoming Natural Gas Injections into Underground Storage (Million Cubic Feet) | ||||||||
| Decade | Year-0 | Year-1 | Year-2 | Year-3 | Year-4 | Year-5 | Year-6 | Year-7 | Year-8 | Year-9 |
|---|---|---|---|---|---|---|---|---|---|---|
| 1960's | 3,748 | 5,337 | 6,695 | |||||||
| 1970's | 8,305 | 11,325 | 11,996 | 9,854 | 7,025 | 13,276 | 10,404 | 10,061 | 8,812 | 11,193 |
| 1980's | 11,194 | 12,695 | 21,860 | 11,546 | 6,110 | 7,565 | 7,701 | 2,932 | 9,719 | 12,546 |
| 1990's | 12,146 | 10,872 | 5,340 | 13,605 | 10,596 | 9,448 | 10,422 | 14,080 | 15,212 | 11,458 |
| 2000's | 6,144 | 19,510 | 19,547 | 18,304 | 26,689 | 18,665 | 19,820 | 22,213 | 19,194 | 24,183 |
| 2010's | 14,762 | 14,102 | 37,107 | 18,868 | 15,440 | 10,236 | 37,499 | 27,027 | 16,783 | 32,195 |
| 2020's | 37,420 | 27,365 | 27,711 | 43,685 | 39,306 | 41,393 |
| - = No Data Reported; -- = Not Applicable; NA = Not Available; W = Withheld to avoid disclosure of individual company data. |
| Release Date: 6/30/2026 |
| Next Release Date: 7/31/2026 |