|
Download Data (XLS File) |
|
||||||||
|
||||||||
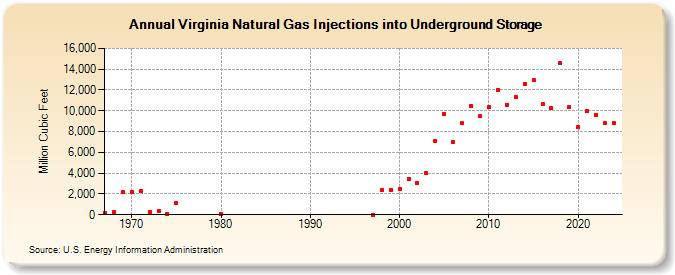
| Virginia Natural Gas Injections into Underground Storage (Million Cubic Feet) | ||||||||
| Decade | Year-0 | Year-1 | Year-2 | Year-3 | Year-4 | Year-5 | Year-6 | Year-7 | Year-8 | Year-9 |
|---|---|---|---|---|---|---|---|---|---|---|
| 1960's | 158 | 272 | 2,143 | |||||||
| 1970's | 2,175 | 2,286 | 278 | 320 | 112 | 1,079 | ||||
| 1980's | 22 | |||||||||
| 1990's | 0 | 2,369 | 2,378 | |||||||
| 2000's | 2,455 | 3,440 | 3,012 | 4,008 | 7,073 | 9,696 | 6,997 | 8,796 | 10,467 | 9,464 |
| 2010's | 10,315 | 12,006 | 10,593 | 11,361 | 12,602 | 12,930 | 10,637 | 10,266 | 14,566 | 10,382 |
| 2020's | 8,433 | 9,939 | 9,633 | 8,797 | 8,806 | 7,669 |
| - = No Data Reported; -- = Not Applicable; NA = Not Available; W = Withheld to avoid disclosure of individual company data. |
| Release Date: 3/31/2026 |
| Next Release Date: 4/30/2026 |