|
Download Data (XLS File) |
|
||||||||
|
||||||||
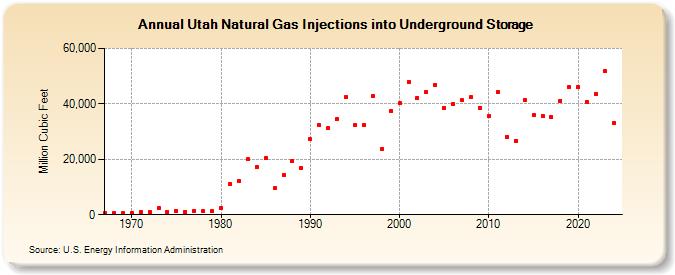
| Utah Natural Gas Injections into Underground Storage (Million Cubic Feet) | ||||||||
| Decade | Year-0 | Year-1 | Year-2 | Year-3 | Year-4 | Year-5 | Year-6 | Year-7 | Year-8 | Year-9 |
|---|---|---|---|---|---|---|---|---|---|---|
| 1960's | 609 | 640 | 580 | |||||||
| 1970's | 547 | 883 | 906 | 2,320 | 999 | 1,340 | 1,069 | 1,446 | 1,180 | 1,193 |
| 1980's | 2,381 | 11,107 | 12,089 | 19,948 | 17,291 | 20,386 | 9,542 | 14,359 | 19,426 | 16,885 |
| 1990's | 27,196 | 32,248 | 31,222 | 34,488 | 42,508 | 32,201 | 32,368 | 42,803 | 23,744 | 37,380 |
| 2000's | 40,179 | 47,942 | 42,159 | 44,227 | 46,829 | 38,478 | 39,761 | 41,284 | 42,304 | 38,618 |
| 2010's | 35,519 | 44,170 | 28,146 | 26,724 | 41,548 | 36,027 | 35,602 | 35,248 | 41,134 | 46,035 |
| 2020's | 46,066 | 40,631 | 43,487 | 51,680 | 33,106 | 41,602 |
| - = No Data Reported; -- = Not Applicable; NA = Not Available; W = Withheld to avoid disclosure of individual company data. |
| Release Date: 6/30/2026 |
| Next Release Date: 7/31/2026 |