|
Download Data (XLS File) |
|
||||||||
|
||||||||
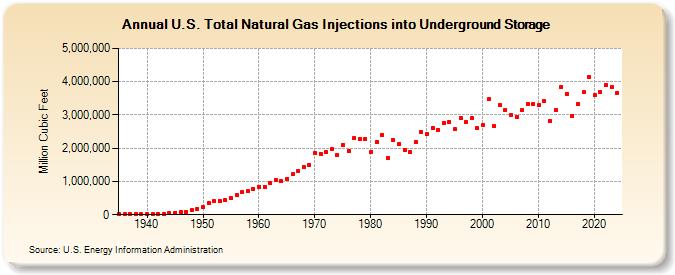
| U.S. Total Natural Gas Injections into Underground Storage (Million Cubic Feet) | ||||||||
| Decade | Year-0 | Year-1 | Year-2 | Year-3 | Year-4 | Year-5 | Year-6 | Year-7 | Year-8 | Year-9 |
|---|---|---|---|---|---|---|---|---|---|---|
| 1930's | 11,294 | 10,998 | 13,706 | 14,981 | 8,032 | |||||
| 1940's | 14,995 | 16,251 | 21,024 | 18,953 | 43,502 | 61,502 | 75,458 | 96,316 | 136,406 | 172,051 |
| 1950's | 229,752 | 347,690 | 398,593 | 404,838 | 432,283 | 505,185 | 589,232 | 672,377 | 704,172 | 787,485 |
| 1960's | 844,352 | 843,666 | 940,823 | 1,047,492 | 1,014,814 | 1,077,980 | 1,210,469 | 1,317,363 | 1,425,075 | 1,496,407 |
| 1970's | 1,856,767 | 1,839,398 | 1,892,952 | 1,974,324 | 1,784,209 | 2,103,619 | 1,918,541 | 2,303,268 | 2,270,961 | 2,285,016 |
| 1980's | 1,896,284 | 2,179,683 | 2,399,355 | 1,700,426 | 2,252,347 | 2,127,932 | 1,952,103 | 1,887,110 | 2,174,328 | 2,491,283 |
| 1990's | 2,433,450 | 2,608,373 | 2,555,393 | 2,759,738 | 2,796,279 | 2,565,882 | 2,905,592 | 2,800,294 | 2,904,755 | 2,597,509 |
| 2000's | 2,684,285 | 3,464,262 | 2,669,844 | 3,291,714 | 3,150,003 | 3,001,582 | 2,924,249 | 3,132,920 | 3,340,365 | 3,314,990 |
| 2010's | 3,291,395 | 3,421,813 | 2,825,427 | 3,155,661 | 3,838,826 | 3,638,340 | 2,976,722 | 3,336,635 | 3,675,913 | 4,152,521 |
| 2020's | 3,589,791 | 3,677,933 | 3,897,816 | 3,841,061 | 3,663,739 | 4,016,683 |
| - = No Data Reported; -- = Not Applicable; NA = Not Available; W = Withheld to avoid disclosure of individual company data. |
| Release Date: 3/31/2026 |
| Next Release Date: 4/30/2026 |