|
Download Data (XLS File) |
|
||||||||
|
||||||||
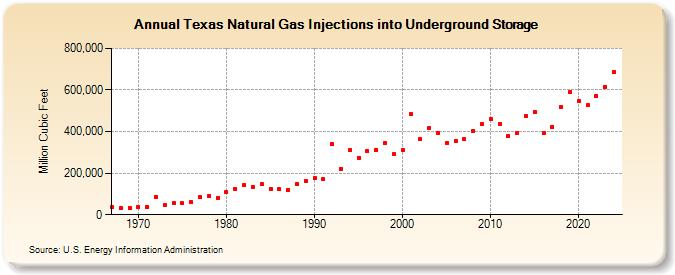
| Texas Natural Gas Injections into Underground Storage (Million Cubic Feet) | ||||||||
| Decade | Year-0 | Year-1 | Year-2 | Year-3 | Year-4 | Year-5 | Year-6 | Year-7 | Year-8 | Year-9 |
|---|---|---|---|---|---|---|---|---|---|---|
| 1960's | 34,836 | 31,597 | 33,943 | |||||||
| 1970's | 36,805 | 36,850 | 87,251 | 46,592 | 54,705 | 54,333 | 61,110 | 85,913 | 91,373 | 82,325 |
| 1980's | 109,242 | 124,439 | 141,811 | 135,309 | 145,916 | 125,560 | 121,631 | 121,245 | 146,758 | 161,181 |
| 1990's | 175,039 | 170,908 | 340,602 | 221,412 | 310,273 | 274,724 | 305,914 | 312,254 | 344,461 | 291,802 |
| 2000's | 311,995 | 482,270 | 363,682 | 415,541 | 395,115 | 345,945 | 356,273 | 362,593 | 401,600 | 435,089 |
| 2010's | 460,453 | 437,440 | 378,438 | 394,375 | 474,392 | 494,375 | 392,965 | 423,589 | 518,252 | 590,187 |
| 2020's | 547,848 | 526,062 | 571,982 | 617,064 | 688,000 | 677,058 |
| - = No Data Reported; -- = Not Applicable; NA = Not Available; W = Withheld to avoid disclosure of individual company data. |
| Release Date: 6/30/2026 |
| Next Release Date: 7/31/2026 |