|
Download Data (XLS File) |
|
||||||||
|
||||||||
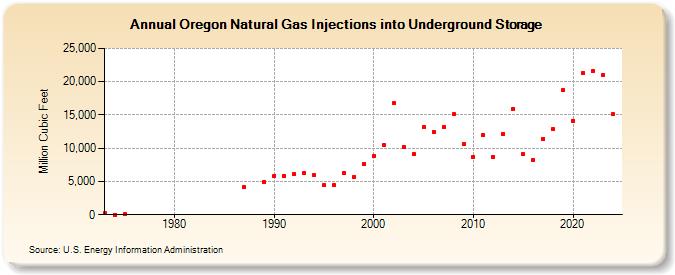
| Oregon Natural Gas Injections into Underground Storage (Million Cubic Feet) | ||||||||
| Decade | Year-0 | Year-1 | Year-2 | Year-3 | Year-4 | Year-5 | Year-6 | Year-7 | Year-8 | Year-9 |
|---|---|---|---|---|---|---|---|---|---|---|
| 1970's | 189 | 5 | 46 | |||||||
| 1980's | 4,148 | 4,944 | ||||||||
| 1990's | 5,894 | 5,853 | 6,114 | 6,202 | 5,956 | 4,447 | 4,416 | 6,259 | 5,673 | 7,605 |
| 2000's | 8,892 | 10,487 | 16,746 | 10,194 | 9,101 | 13,138 | 12,449 | 13,195 | 15,088 | 10,570 |
| 2010's | 8,658 | 11,976 | 8,732 | 12,176 | 15,858 | 9,061 | 8,267 | 11,442 | 12,844 | 18,674 |
| 2020's | 14,149 | 21,270 | 21,566 | 21,045 | 15,082 | 19,235 |
| - = No Data Reported; -- = Not Applicable; NA = Not Available; W = Withheld to avoid disclosure of individual company data. |
| Release Date: 6/30/2026 |
| Next Release Date: 7/31/2026 |