|
Download Data (XLS File) |
|
||||||||
|
||||||||
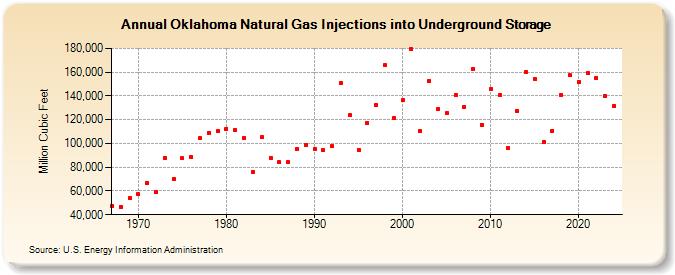
| Oklahoma Natural Gas Injections into Underground Storage (Million Cubic Feet) | ||||||||
| Decade | Year-0 | Year-1 | Year-2 | Year-3 | Year-4 | Year-5 | Year-6 | Year-7 | Year-8 | Year-9 |
|---|---|---|---|---|---|---|---|---|---|---|
| 1960's | 47,438 | 46,871 | 53,945 | |||||||
| 1970's | 57,142 | 66,666 | 59,061 | 88,000 | 70,076 | 87,459 | 88,577 | 104,347 | 109,076 | 110,354 |
| 1980's | 112,403 | 111,148 | 104,572 | 75,872 | 105,055 | 87,860 | 84,072 | 84,031 | 95,241 | 98,370 |
| 1990's | 95,274 | 94,221 | 97,468 | 151,249 | 123,576 | 94,809 | 117,067 | 132,489 | 165,631 | 121,312 |
| 2000's | 136,287 | 179,459 | 110,539 | 152,536 | 128,902 | 125,362 | 140,895 | 130,927 | 162,457 | 115,885 |
| 2010's | 145,951 | 140,729 | 95,877 | 127,670 | 160,232 | 154,368 | 101,193 | 110,685 | 141,169 | 157,305 |
| 2020's | 151,743 | 159,348 | 154,905 | 139,801 | 131,891 | 154,270 |
| - = No Data Reported; -- = Not Applicable; NA = Not Available; W = Withheld to avoid disclosure of individual company data. |
| Release Date: 6/30/2026 |
| Next Release Date: 7/31/2026 |