|
Download Data (XLS File) |
|
||||||||
|
||||||||
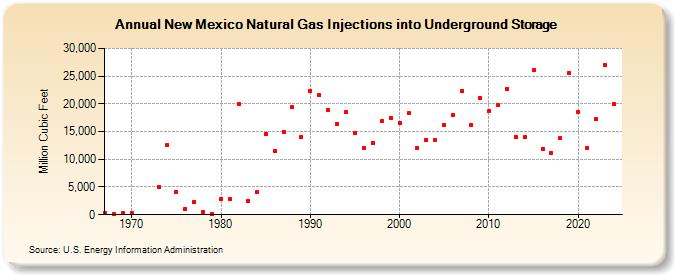
| New Mexico Natural Gas Injections into Underground Storage (Million Cubic Feet) | ||||||||
| Decade | Year-0 | Year-1 | Year-2 | Year-3 | Year-4 | Year-5 | Year-6 | Year-7 | Year-8 | Year-9 |
|---|---|---|---|---|---|---|---|---|---|---|
| 1960's | 383 | 74 | 383 | |||||||
| 1970's | 398 | 5,067 | 12,589 | 4,160 | 1,005 | 2,378 | 472 | 39 | ||
| 1980's | 2,871 | 2,801 | 19,894 | 2,500 | 4,033 | 14,552 | 11,531 | 14,892 | 19,407 | 14,036 |
| 1990's | 22,352 | 21,563 | 18,963 | 16,369 | 18,551 | 14,712 | 11,953 | 12,936 | 16,821 | 17,459 |
| 2000's | 16,529 | 18,263 | 12,032 | 13,544 | 13,422 | 16,131 | 18,011 | 22,390 | 16,132 | 21,094 |
| 2010's | 18,643 | 19,738 | 22,732 | 14,077 | 14,010 | 26,085 | 11,886 | 11,146 | 13,874 | 25,611 |
| 2020's | 18,576 | 11,983 | 17,349 | 26,990 | 19,947 | 23,014 |
| - = No Data Reported; -- = Not Applicable; NA = Not Available; W = Withheld to avoid disclosure of individual company data. |
| Release Date: 6/30/2026 |
| Next Release Date: 7/31/2026 |