|
Download Data (XLS File) |
|
||||||||
|
||||||||
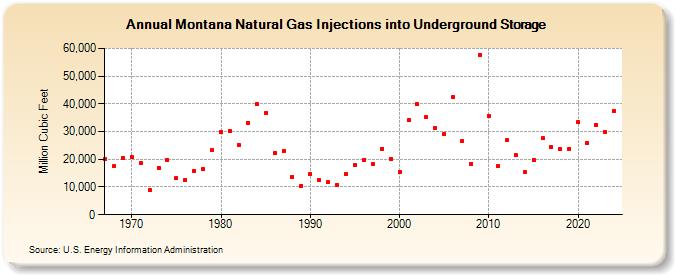
| Montana Natural Gas Injections into Underground Storage (Million Cubic Feet) | ||||||||
| Decade | Year-0 | Year-1 | Year-2 | Year-3 | Year-4 | Year-5 | Year-6 | Year-7 | Year-8 | Year-9 |
|---|---|---|---|---|---|---|---|---|---|---|
| 1960's | 19,919 | 17,398 | 20,409 | |||||||
| 1970's | 20,891 | 18,668 | 8,801 | 16,969 | 19,791 | 13,090 | 12,507 | 15,908 | 16,351 | 23,254 |
| 1980's | 29,751 | 30,147 | 25,180 | 33,262 | 39,814 | 36,786 | 22,084 | 22,894 | 13,782 | 10,479 |
| 1990's | 14,648 | 12,392 | 11,708 | 10,894 | 14,690 | 18,054 | 19,871 | 18,219 | 23,876 | 20,232 |
| 2000's | 15,571 | 33,998 | 39,809 | 35,082 | 31,339 | 29,118 | 42,492 | 26,512 | 18,394 | 57,631 |
| 2010's | 35,577 | 17,582 | 26,813 | 21,426 | 15,290 | 19,826 | 27,573 | 24,340 | 23,554 | 23,852 |
| 2020's | 33,342 | 25,903 | 32,515 | 29,758 | 37,497 | 27,242 |
| - = No Data Reported; -- = Not Applicable; NA = Not Available; W = Withheld to avoid disclosure of individual company data. |
| Release Date: 6/30/2026 |
| Next Release Date: 7/31/2026 |