|
Download Data (XLS File) |
|
||||||||
|
||||||||
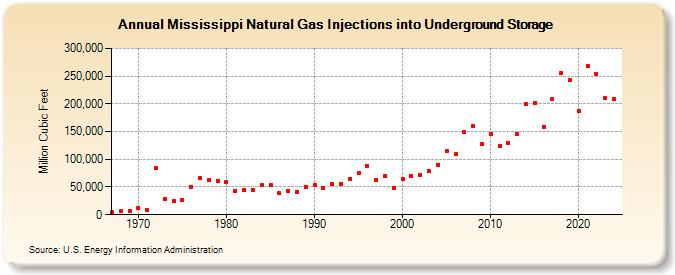
| Mississippi Natural Gas Injections into Underground Storage (Million Cubic Feet) | ||||||||
| Decade | Year-0 | Year-1 | Year-2 | Year-3 | Year-4 | Year-5 | Year-6 | Year-7 | Year-8 | Year-9 |
|---|---|---|---|---|---|---|---|---|---|---|
| 1960's | 4,701 | 6,904 | 7,493 | |||||||
| 1970's | 12,489 | 8,149 | 83,548 | 29,089 | 25,439 | 27,345 | 50,545 | 65,693 | 63,032 | 60,597 |
| 1980's | 59,653 | 42,916 | 43,834 | 44,467 | 54,186 | 54,105 | 38,678 | 43,550 | 41,780 | 50,478 |
| 1990's | 53,161 | 48,054 | 55,105 | 55,903 | 64,972 | 74,821 | 88,684 | 63,216 | 69,268 | 48,217 |
| 2000's | 63,917 | 68,987 | 72,418 | 79,014 | 90,316 | 114,658 | 108,823 | 148,487 | 160,388 | 127,212 |
| 2010's | 145,854 | 124,165 | 129,889 | 145,082 | 199,696 | 201,967 | 159,070 | 209,156 | 256,329 | 242,312 |
| 2020's | 186,819 | 268,902 | 253,075 | 209,776 | 208,690 | 249,355 |
| - = No Data Reported; -- = Not Applicable; NA = Not Available; W = Withheld to avoid disclosure of individual company data. |
| Release Date: 6/30/2026 |
| Next Release Date: 7/31/2026 |