|
Download Data (XLS File) |
|
||||||||
|
||||||||
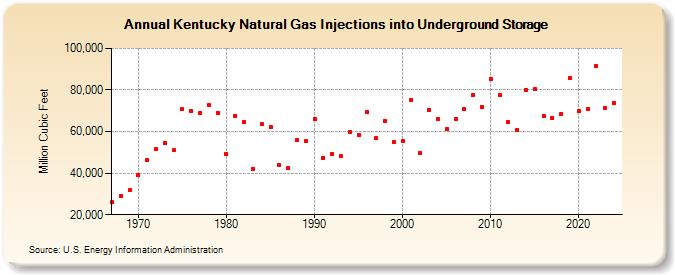
| Kentucky Natural Gas Injections into Underground Storage (Million Cubic Feet) | ||||||||
| Decade | Year-0 | Year-1 | Year-2 | Year-3 | Year-4 | Year-5 | Year-6 | Year-7 | Year-8 | Year-9 |
|---|---|---|---|---|---|---|---|---|---|---|
| 1960's | 26,084 | 28,993 | 31,726 | |||||||
| 1970's | 38,968 | 46,139 | 51,437 | 54,392 | 50,903 | 70,609 | 69,954 | 69,097 | 72,674 | 68,961 |
| 1980's | 49,142 | 67,518 | 64,789 | 42,090 | 63,617 | 62,202 | 43,698 | 42,388 | 55,774 | 55,277 |
| 1990's | 66,195 | 47,425 | 49,367 | 48,117 | 59,831 | 58,561 | 69,498 | 57,073 | 65,267 | 55,134 |
| 2000's | 55,348 | 75,165 | 49,577 | 70,497 | 66,037 | 61,190 | 65,956 | 70,682 | 77,503 | 71,972 |
| 2010's | 85,167 | 77,526 | 64,483 | 60,782 | 80,129 | 80,247 | 67,526 | 66,373 | 68,502 | 85,781 |
| 2020's | 69,736 | 70,823 | 91,584 | 71,310 | 73,921 | 97,646 |
| - = No Data Reported; -- = Not Applicable; NA = Not Available; W = Withheld to avoid disclosure of individual company data. |
| Release Date: 6/30/2026 |
| Next Release Date: 7/31/2026 |