|
Download Data (XLS File) |
|
||||||||
|
||||||||
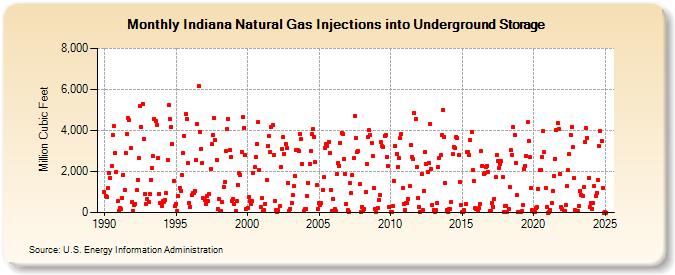
| Indiana Natural Gas Injections into Underground Storage (Million Cubic Feet) | ||||||||
| Year | Jan | Feb | Mar | Apr | May | Jun | Jul | Aug | Sep | Oct | Nov | Dec |
|---|---|---|---|---|---|---|---|---|---|---|---|---|
| 1990 | 997 | 821 | 771 | 1,207 | 1,916 | 1,673 | 2,268 | 3,772 | 4,202 | 2,896 | 1,993 | 539 |
| 1991 | 91 | 245 | 158 | 710 | 1,849 | 1,107 | 2,920 | 3,845 | 4,606 | 4,490 | 3,131 | 501 |
| 1992 | 98 | 349 | 429 | 1,076 | 1,611 | 2,638 | 5,174 | 4,168 | 5,309 | 3,579 | 926 | 413 |
| 1993 | 681 | 526 | 882 | 1,587 | 2,170 | 2,733 | 4,564 | 4,464 | 4,276 | 2,659 | 911 | 475 |
| 1994 | 328 | 565 | 519 | 609 | 934 | 2,541 | 5,229 | 4,565 | 4,175 | 3,340 | 1,546 | 305 |
| 1995 | 439 | 80 | 786 | 1,211 | 1,057 | 1,831 | 2,892 | 3,751 | 4,791 | 4,578 | 2,437 | 483 |
| 1996 | 262 | 870 | 948 | 968 | 1,028 | 2,560 | 4,317 | 6,153 | 3,943 | 3,112 | 2,407 | 696 |
| 1997 | 609 | 435 | 815 | 546 | 893 | 2,117 | 3,322 | 3,775 | 4,610 | 3,523 | 2,584 | 175 |
| 1998 | 648 | 87 | 86 | 508 | 1,235 | 1,495 | 2,999 | 4,082 | 4,578 | 3,026 | 2,710 | 581 |
| 1999 | 659 | 437 | 76 | 545 | 1,348 | 1,904 | 1,841 | 2,974 | 4,679 | 4,121 | 2,789 | 160 |
| 2000 | 239 | 748 | 554 | 416 | 540 | 1,951 | 2,214 | 2,727 | 3,347 | 4,389 | 2,098 | 262 |
| 2001 | 724 | 52 | 104 | 424 | 1,577 | 3,239 | 3,738 | 2,971 | 4,160 | 4,261 | 2,824 | 574 |
| 2002 | 119 | 48 | 102 | 297 | 2,208 | 3,101 | 3,662 | 2,842 | 3,362 | 3,143 | 1,449 | 91 |
| 2003 | 196 | 456 | 838 | 1,271 | 1,784 | 3,070 | 3,042 | 3,011 | 3,834 | 3,594 | 2,389 | 79 |
| 2004 | 170 | 191 | 784 | 1,459 | 2,351 | 3,009 | 3,807 | 4,049 | 3,668 | 2,450 | 1,322 | 190 |
| 2005 | 458 | 364 | 469 | 1,080 | 1,712 | 3,169 | 3,344 | 3,256 | 3,462 | 2,921 | 1,109 | 61 |
| 2006 | 653 | 184 | 100 | 1,885 | 2,426 | 2,290 | 3,414 | 3,892 | 3,839 | 2,591 | 1,891 | 433 |
| 2007 | 102 | 40 | 1,422 | 939 | 1,832 | 2,657 | 4,716 | 3,615 | 2,948 | 2,984 | 1,396 | 35 |
| 2008 | 282 | 70 | 162 | 1,010 | 2,383 | 3,688 | 4,008 | 3,769 | 3,379 | 2,738 | 1,196 | 189 |
| 2009 | 24 | 230 | 617 | 866 | 3,424 | 3,240 | 3,214 | 3,752 | 3,770 | 2,731 | 2,272 | 261 |
| 2010 | 9 | 9 | 312 | 1,544 | 3,257 | 2,868 | 2,243 | 2,644 | 3,611 | 3,832 | 1,201 | 412 |
| 2011 | 109 | 474 | 458 | 640 | 1,272 | 3,273 | 2,700 | 2,598 | 4,854 | 4,538 | 2,239 | 707 |
| 2012 | 274 | 34 | 1,886 | 102 | 1,048 | 2,946 | 2,386 | 1,994 | 2,429 | 4,307 | 2,120 | 352 |
| 2013 | 135 | 29 | 116 | 461 | 2,204 | 2,677 | 2,798 | 3,774 | 5,015 | 3,670 | 1,438 | 118 |
| 2014 | 40 | 156 | 153 | 506 | 2,831 | 3,214 | 3,166 | 3,696 | 3,621 | 2,822 | 1,493 | 368 |
| 2015 | 46 | 22 | 135 | 415 | 2,928 | 2,972 | 2,783 | 3,528 | 3,907 | 2,068 | 1,525 | 213 |
| 2016 | 166 | 119 | 201 | 439 | 2,997 | 2,269 | 1,884 | 1,925 | 2,242 | 2,273 | 1,968 | 68 |
| 2017 | 100 | 470 | 293 | 653 | 1,715 | 2,807 | 2,489 | 2,195 | 2,356 | 2,500 | 1,714 | 20 |
| 2018 | 315 | 327 | 21 | 188 | 1,244 | 3,028 | 2,828 | 4,158 | 3,772 | 2,435 | 845 | 32 |
| 2019 | 42 | 9 | 82 | 350 | 2,106 | 2,282 | 2,753 | 4,390 | 3,466 | 2,716 | 1,183 | 101 |
| 2020 | 25 | 12 | 233 | 280 | 1,155 | 2,061 | 2,073 | 2,699 | 3,964 | 2,935 | 1,219 | 291 |
| 2021 | 0 | 37 | 124 | 461 | 1,059 | 1,788 | 2,613 | 4,006 | 4,362 | 4,083 | 1,897 | 257 |
| 2022 | 160 | 61 | 78 | 358 | 1,279 | 2,050 | 2,839 | 3,786 | 4,160 | 3,175 | 1,694 | 106 |
| 2023 | 92 | 69 | 318 | 1,072 | 880 | 805 | 1,228 | 3,457 | 4,105 | 3,652 | 1,702 | 250 |
| 2024 | 476 | 190 | 463 | 1,297 | 807 | 967 | 1,610 | 3,237 | 3,969 | 3,501 | 1,215 | 1 |
| 2025 | 14 | 0 | 159 | 893 | 2,069 | 2,080 | 2,486 | 3,977 | 4,337 | 3,082 | 986 | 6 |
| 2026 | 9 | 16 | 149 | 1,012 | ||||||||
| - = No Data Reported; -- = Not Applicable; NA = Not Available; W = Withheld to avoid disclosure of individual company data. |
| Release Date: 6/30/2026 |
| Next Release Date: 7/31/2026 |