|
Download Data (XLS File) |
|
||||||||
|
||||||||
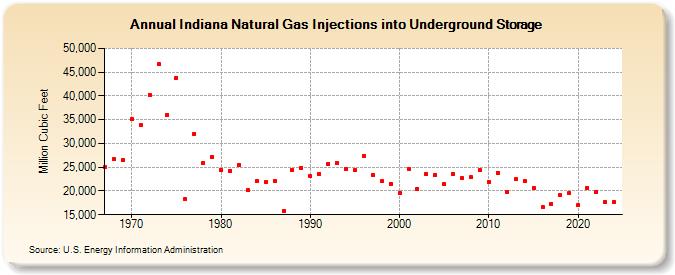
| Indiana Natural Gas Injections into Underground Storage (Million Cubic Feet) | ||||||||
| Decade | Year-0 | Year-1 | Year-2 | Year-3 | Year-4 | Year-5 | Year-6 | Year-7 | Year-8 | Year-9 |
|---|---|---|---|---|---|---|---|---|---|---|
| 1960's | 25,027 | 26,679 | 26,483 | |||||||
| 1970's | 35,065 | 33,816 | 40,220 | 46,617 | 36,070 | 43,845 | 18,252 | 32,090 | 25,903 | 27,177 |
| 1980's | 24,509 | 24,301 | 25,489 | 20,160 | 22,069 | 21,885 | 22,118 | 15,844 | 24,423 | 24,816 |
| 1990's | 23,054 | 23,654 | 25,770 | 25,928 | 24,656 | 24,335 | 27,263 | 23,403 | 22,034 | 21,533 |
| 2000's | 19,486 | 24,647 | 20,425 | 23,563 | 23,451 | 21,405 | 23,598 | 22,686 | 22,874 | 24,399 |
| 2010's | 21,943 | 23,864 | 19,878 | 22,435 | 22,067 | 20,542 | 16,551 | 17,312 | 19,193 | 19,484 |
| 2020's | 16,947 | 20,687 | 19,747 | 17,630 | 17,734 | 20,089 |
| - = No Data Reported; -- = Not Applicable; NA = Not Available; W = Withheld to avoid disclosure of individual company data. |
| Release Date: 6/30/2026 |
| Next Release Date: 7/31/2026 |