|
Download Data (XLS File) |
|
||||||||
|
||||||||
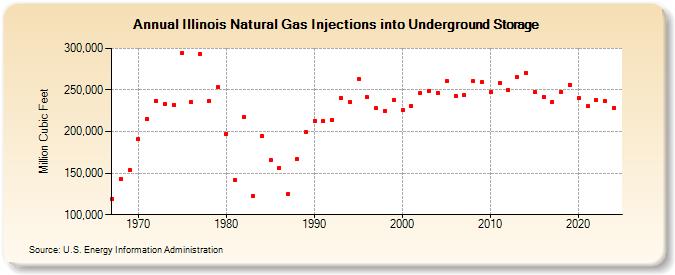
| Illinois Natural Gas Injections into Underground Storage (Million Cubic Feet) | ||||||||
| Decade | Year-0 | Year-1 | Year-2 | Year-3 | Year-4 | Year-5 | Year-6 | Year-7 | Year-8 | Year-9 |
|---|---|---|---|---|---|---|---|---|---|---|
| 1960's | 119,125 | 143,180 | 153,497 | |||||||
| 1970's | 190,661 | 214,871 | 237,098 | 233,112 | 232,284 | 294,689 | 235,310 | 293,311 | 236,669 | 253,320 |
| 1980's | 197,385 | 141,824 | 217,536 | 122,620 | 194,327 | 165,688 | 156,754 | 125,066 | 166,713 | 199,165 |
| 1990's | 213,076 | 212,232 | 214,404 | 240,515 | 235,778 | 263,409 | 241,129 | 227,785 | 225,089 | 238,325 |
| 2000's | 225,524 | 231,097 | 246,574 | 249,228 | 246,747 | 260,515 | 242,754 | 243,789 | 260,333 | 259,421 |
| 2010's | 247,458 | 258,690 | 249,953 | 265,175 | 270,831 | 247,839 | 241,587 | 235,564 | 248,114 | 256,390 |
| 2020's | 240,000 | 230,330 | 238,039 | 236,501 | 228,342 | 238,141 |
| - = No Data Reported; -- = Not Applicable; NA = Not Available; W = Withheld to avoid disclosure of individual company data. |
| Release Date: 6/30/2026 |
| Next Release Date: 7/31/2026 |