|
Download Data (XLS File) |
|
||||||||
|
||||||||
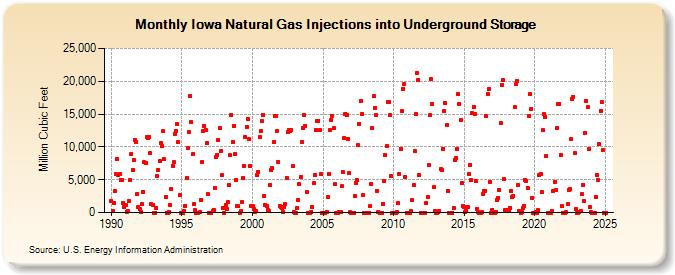
| Iowa Natural Gas Injections into Underground Storage (Million Cubic Feet) | ||||||||
| Year | Jan | Feb | Mar | Apr | May | Jun | Jul | Aug | Sep | Oct | Nov | Dec |
|---|---|---|---|---|---|---|---|---|---|---|---|---|
| 1990 | 1,740 | 243 | 1,516 | 3,236 | 5,817 | 8,184 | 5,657 | 5,928 | 4,903 | 4,971 | 1,423 | 854 |
| 1991 | 1,166 | 155 | 231 | 1,829 | 4,897 | 8,985 | 6,518 | 8,058 | 11,039 | 10,758 | 2,782 | 860 |
| 1992 | 488 | 43 | 1,246 | 3,184 | 7,652 | 7,568 | 11,453 | 11,281 | 11,472 | 9,000 | 1,228 | 1,203 |
| 1993 | 0 | 0 | 733 | 5,547 | 6,489 | 7,776 | 10,550 | 10,150 | 12,351 | 8,152 | 2,437 | 0 |
| 1994 | 0 | 75 | 1,162 | 3,601 | 7,153 | 7,638 | 11,999 | 12,405 | 13,449 | 10,767 | 2,678 | 0 |
| 1995 | 0 | 0 | 251 | 1,041 | 5,294 | 9,889 | 12,219 | 17,805 | 13,756 | 8,855 | 1,283 | 391 |
| 1996 | 2 | 2 | 0 | 40 | 1,921 | 7,679 | 12,393 | 13,168 | 12,537 | 10,556 | 2,760 | 0 |
| 1997 | 0 | 0 | 202 | 428 | 3,803 | 8,403 | 8,823 | 11,004 | 12,830 | 9,325 | 5,661 | 654 |
| 1998 | 0 | 1,159 | 594 | 1,633 | 4,246 | 8,751 | 14,863 | 10,727 | 13,187 | 8,873 | 4,979 | 992 |
| 1999 | 936 | 0 | 223 | 1,593 | 5,328 | 7,143 | 11,494 | 13,101 | 14,261 | 11,172 | 7,111 | 1,038 |
| 2000 | 941 | 557 | 33 | 258 | 5,672 | 6,200 | 11,478 | 12,376 | 13,893 | 14,872 | 2,526 | 1,088 |
| 2001 | 973 | 430 | 294 | 4,240 | 6,546 | 6,791 | 10,728 | 14,677 | 14,710 | 12,486 | 7,702 | 967 |
| 2002 | 806 | 743 | 159 | 867 | 1,299 | 5,317 | 12,204 | 12,601 | 12,496 | 12,510 | 7,048 | 151 |
| 2003 | 0 | 5 | 665 | 1,935 | 4,282 | 5,343 | 10,717 | 12,890 | 14,855 | 13,232 | 3,094 | 1 |
| 2004 | 2 | 8 | 147 | 803 | 4,447 | 5,697 | 12,605 | 13,988 | 13,987 | 12,545 | 5,864 | 5 |
| 2005 | 6 | 0 | 7 | 36 | 2,389 | 5,936 | 12,497 | 14,043 | 14,754 | 12,825 | 4,333 | 1 |
| 2006 | 1 | 3 | 18 | 120 | 3,993 | 6,106 | 11,386 | 15,051 | 14,846 | 11,212 | 5,949 | 62 |
| 2007 | 0 | 6 | 0 | 2,500 | 4,567 | 4,957 | 10,224 | 13,524 | 16,933 | 14,938 | 2,677 | 1 |
| 2008 | 0 | 1 | 5 | 1 | 927 | 4,376 | 12,811 | 17,703 | 15,969 | 14,794 | 3,357 | 79 |
| 2009 | 0 | 0 | 2 | 1,365 | 4,773 | 8,762 | 10,126 | 16,807 | 16,847 | 14,799 | 5,529 | 0 |
| 2010 | 1 | 0 | 1 | 37 | 1,486 | 5,925 | 9,704 | 15,411 | 18,869 | 19,558 | 5,417 | 0 |
| 2011 | 3 | 1 | 0 | 178 | 1,910 | 4,180 | 9,300 | 14,945 | 21,313 | 20,248 | 5,704 | 0 |
| 2012 | 1 | 3 | 1 | 2 | 1,448 | 2,379 | 7,265 | 14,786 | 20,264 | 16,517 | 3,853 | 255 |
| 2013 | 8 | 1 | 22 | 228 | 6,604 | 6,409 | 9,737 | 15,463 | 16,682 | 13,299 | 3,339 | 2 |
| 2014 | 2 | 6 | 8 | 729 | 8,047 | 8,300 | 9,617 | 18,025 | 16,594 | 14,029 | 4,467 | 1,042 |
| 2015 | 840 | 39 | 190 | 902 | 5,893 | 7,315 | 4,900 | 15,146 | 16,146 | 15,050 | 4,798 | 548 |
| 2016 | 122 | 1 | 1 | 17 | 2,858 | 3,331 | 3,323 | 14,680 | 18,041 | 18,750 | 4,711 | 2 |
| 2017 | 433 | 6 | 0 | 102 | 1,905 | 2,268 | 3,480 | 13,686 | 19,447 | 20,118 | 5,142 | 345 |
| 2018 | 182 | 431 | 199 | 761 | 3,253 | 2,305 | 2,539 | 16,016 | 19,504 | 19,974 | 4,191 | 213 |
| 2019 | 7 | 116 | 680 | 1,054 | 4,917 | 4,864 | 3,778 | 14,752 | 18,005 | 15,835 | 2,266 | 1 |
| 2020 | 2 | 102 | 2 | 315 | 5,645 | 5,842 | 3,112 | 12,526 | 14,936 | 14,561 | 8,566 | 1 |
| 2021 | 1 | 5 | 5 | 165 | 3,279 | 4,726 | 3,364 | 12,818 | 16,486 | 16,607 | 8,753 | 1,071 |
| 2022 | 1 | 3 | 5 | 18 | 1,241 | 3,398 | 3,534 | 11,221 | 17,235 | 17,648 | 9,039 | 528 |
| 2023 | 1 | 4 | 10 | 178 | 2,811 | 4,259 | 1,831 | 12,047 | 16,991 | 16,033 | 9,683 | 822 |
| 2024 | 22 | 4 | 5 | 1 | 2,431 | 5,791 | 5,003 | 10,402 | 15,503 | 16,870 | 9,591 | 0 |
| 2025 | 1 | 5 | 4 | 331 | 4,549 | 4,820 | 1,384 | 6,565 | 15,149 | 17,780 | 10,396 | 333 |
| 2026 | 514 | 4 | 2 | 226 | ||||||||
| - = No Data Reported; -- = Not Applicable; NA = Not Available; W = Withheld to avoid disclosure of individual company data. |
| Release Date: 6/30/2026 |
| Next Release Date: 7/31/2026 |