|
Download Data (XLS File) |
|
||||||||
|
||||||||
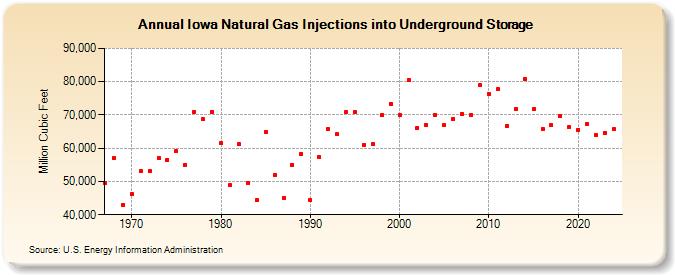
| Iowa Natural Gas Injections into Underground Storage (Million Cubic Feet) | ||||||||
| Decade | Year-0 | Year-1 | Year-2 | Year-3 | Year-4 | Year-5 | Year-6 | Year-7 | Year-8 | Year-9 |
|---|---|---|---|---|---|---|---|---|---|---|
| 1960's | 49,603 | 57,082 | 43,037 | |||||||
| 1970's | 46,301 | 53,186 | 53,137 | 57,011 | 56,505 | 59,065 | 55,005 | 71,002 | 68,772 | 70,967 |
| 1980's | 61,413 | 48,918 | 61,121 | 49,523 | 44,355 | 64,993 | 52,084 | 45,128 | 55,076 | 58,386 |
| 1990's | 44,471 | 57,278 | 65,818 | 64,184 | 70,926 | 70,785 | 61,060 | 61,132 | 70,001 | 73,398 |
| 2000's | 69,893 | 80,546 | 66,202 | 67,017 | 70,097 | 66,827 | 68,750 | 70,329 | 70,022 | 79,012 |
| 2010's | 76,407 | 77,783 | 66,774 | 71,793 | 80,866 | 71,767 | 65,836 | 66,933 | 69,569 | 66,275 |
| 2020's | 65,609 | 67,280 | 63,871 | 64,669 | 65,622 | 61,318 |
| - = No Data Reported; -- = Not Applicable; NA = Not Available; W = Withheld to avoid disclosure of individual company data. |
| Release Date: 6/30/2026 |
| Next Release Date: 7/31/2026 |