|
Download Data (XLS File) |
|
||||||||
|
||||||||
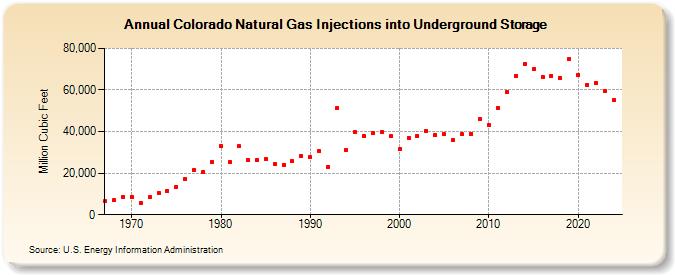
| Colorado Natural Gas Injections into Underground Storage (Million Cubic Feet) | ||||||||
| Decade | Year-0 | Year-1 | Year-2 | Year-3 | Year-4 | Year-5 | Year-6 | Year-7 | Year-8 | Year-9 |
|---|---|---|---|---|---|---|---|---|---|---|
| 1960's | 6,391 | 6,849 | 8,663 | |||||||
| 1970's | 8,757 | 5,839 | 8,502 | 10,673 | 11,444 | 13,420 | 16,987 | 21,717 | 20,630 | 25,334 |
| 1980's | 32,974 | 25,291 | 32,861 | 26,361 | 26,228 | 26,722 | 24,313 | 24,083 | 25,898 | 28,165 |
| 1990's | 27,674 | 30,584 | 23,061 | 51,132 | 31,185 | 39,717 | 37,808 | 39,389 | 39,789 | 37,828 |
| 2000's | 31,601 | 36,951 | 37,980 | 40,146 | 38,320 | 38,588 | 35,836 | 38,619 | 39,034 | 45,861 |
| 2010's | 43,250 | 51,469 | 59,096 | 66,935 | 72,510 | 69,983 | 66,285 | 66,841 | 65,866 | 74,897 |
| 2020's | 67,332 | 62,575 | 63,453 | 59,573 | 55,110 | 61,094 |
| - = No Data Reported; -- = Not Applicable; NA = Not Available; W = Withheld to avoid disclosure of individual company data. |
| Release Date: 6/30/2026 |
| Next Release Date: 7/31/2026 |