|
Download Data (XLS File) |
|
||||||||
|
||||||||
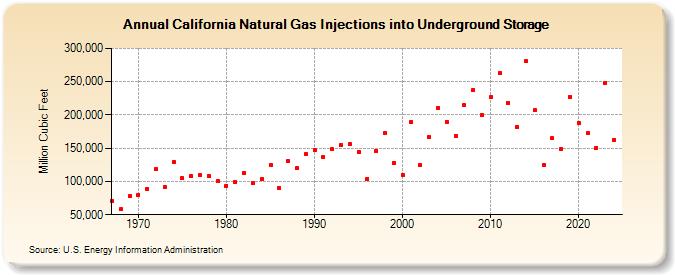
| California Natural Gas Injections into Underground Storage (Million Cubic Feet) | ||||||||
| Decade | Year-0 | Year-1 | Year-2 | Year-3 | Year-4 | Year-5 | Year-6 | Year-7 | Year-8 | Year-9 |
|---|---|---|---|---|---|---|---|---|---|---|
| 1960's | 71,148 | 58,085 | 77,617 | |||||||
| 1970's | 80,260 | 89,373 | 118,758 | 92,331 | 129,945 | 105,167 | 107,749 | 109,760 | 108,432 | 100,522 |
| 1980's | 93,556 | 99,397 | 112,916 | 97,424 | 103,983 | 124,099 | 89,891 | 130,990 | 120,167 | 140,933 |
| 1990's | 147,074 | 136,433 | 148,039 | 155,135 | 155,910 | 144,312 | 104,238 | 145,511 | 172,343 | 128,420 |
| 2000's | 110,172 | 189,640 | 124,641 | 166,879 | 211,010 | 190,055 | 168,957 | 214,469 | 237,364 | 199,763 |
| 2010's | 226,810 | 263,067 | 218,663 | 182,046 | 280,516 | 206,774 | 124,474 | 164,662 | 149,116 | 227,447 |
| 2020's | 187,732 | 172,405 | 150,795 | 248,084 | 162,819 | 183,694 |
| - = No Data Reported; -- = Not Applicable; NA = Not Available; W = Withheld to avoid disclosure of individual company data. |
| Release Date: 6/30/2026 |
| Next Release Date: 7/31/2026 |