|
Download Data (XLS File) |
|
||||||||
|
||||||||
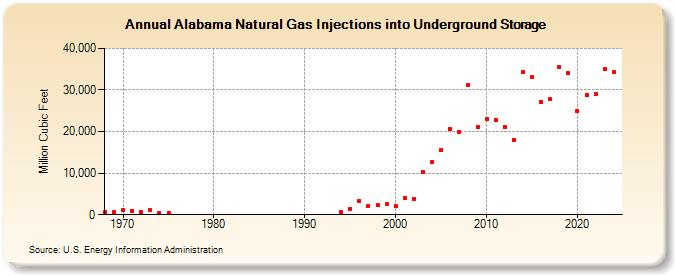
| Alabama Natural Gas Injections into Underground Storage (Million Cubic Feet) | ||||||||
| Decade | Year-0 | Year-1 | Year-2 | Year-3 | Year-4 | Year-5 | Year-6 | Year-7 | Year-8 | Year-9 |
|---|---|---|---|---|---|---|---|---|---|---|
| 1960's | 536 | 577 | ||||||||
| 1970's | 1,153 | 992 | 568 | 1,070 | 410 | 434 | ||||
| 1990's | 694 | 1,375 | 3,349 | 2,022 | 2,220 | 2,646 | ||||
| 2000's | 2,022 | 3,913 | 3,785 | 10,190 | 12,734 | 15,572 | 20,604 | 20,009 | 31,208 | 21,020 |
| 2010's | 23,026 | 22,766 | 21,195 | 17,966 | 34,286 | 33,004 | 27,191 | 27,737 | 35,430 | 33,963 |
| 2020's | 25,026 | 28,854 | 28,912 | 34,931 | 34,260 | 43,202 |
| - = No Data Reported; -- = Not Applicable; NA = Not Available; W = Withheld to avoid disclosure of individual company data. |
| Release Date: 6/30/2026 |
| Next Release Date: 7/31/2026 |