|
Download Data (XLS File) |
|
||||||||
|
||||||||
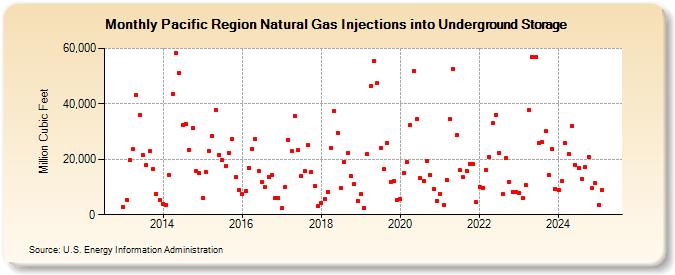
| Pacific Region Natural Gas Injections into Underground Storage (Million Cubic Feet) | ||||||||
| Year | Jan | Feb | Mar | Apr | May | Jun | Jul | Aug | Sep | Oct | Nov | Dec |
|---|---|---|---|---|---|---|---|---|---|---|---|---|
| 2013 | 2,847 | 5,404 | 19,624 | 23,531 | 43,090 | 36,063 | 21,465 | 18,052 | 22,869 | 16,634 | 7,638 | 5,214 |
| 2014 | 4,011 | 3,540 | 14,172 | 43,546 | 58,466 | 51,172 | 32,264 | 32,879 | 23,448 | 31,224 | 15,841 | 14,871 |
| 2015 | 5,947 | 15,411 | 23,160 | 28,448 | 37,851 | 21,448 | 19,718 | 17,633 | 22,413 | 27,233 | 13,622 | 8,742 |
| 2016 | 7,399 | 8,534 | 16,892 | 23,819 | 27,387 | 15,867 | 11,961 | 10,000 | 13,743 | 14,245 | 5,967 | 6,100 |
| 2017 | 2,247 | 10,138 | 27,128 | 22,839 | 35,465 | 23,338 | 13,799 | 15,836 | 25,231 | 15,543 | 10,351 | 2,976 |
| 2018 | 4,311 | 5,496 | 8,332 | 24,167 | 37,370 | 29,551 | 9,706 | 19,174 | 22,269 | 13,905 | 10,933 | 5,083 |
| 2019 | 7,304 | 2,569 | 21,754 | 46,471 | 55,354 | 47,390 | 24,245 | 16,624 | 25,884 | 11,807 | 12,059 | 5,327 |
| 2020 | 5,661 | 14,914 | 18,847 | 32,310 | 51,756 | 34,589 | 13,134 | 12,230 | 19,470 | 14,328 | 9,271 | 4,988 |
| 2021 | 7,593 | 3,487 | 12,670 | 34,376 | 52,642 | 28,601 | 15,957 | 13,439 | 15,884 | 18,360 | 18,319 | 4,423 |
| 2022 | 9,934 | 9,645 | 16,041 | 20,989 | 32,974 | 35,974 | 22,413 | 7,332 | 20,458 | 11,900 | 8,322 | 8,298 |
| 2023 | 7,792 | 5,858 | 10,616 | 37,825 | 57,003 | 56,752 | 26,001 | 26,073 | 30,087 | 14,217 | 23,550 | 9,448 |
| 2024 | 8,924 | 12,055 | 25,745 | 21,952 | 32,055 | 18,096 | 16,806 | 12,989 | 17,242 | 20,921 | 9,535 | 11,324 |
| 2025 | 3,381 | 8,826 | 21,948 | 29,165 | 34,354 | 32,202 | 21,549 | 8,427 | 15,923 | 22,744 | 13,839 | 15,347 |
| 2026 | 8,760 | 11,003 | 13,747 | 22,308 | ||||||||
| - = No Data Reported; -- = Not Applicable; NA = Not Available; W = Withheld to avoid disclosure of individual company data. |
| Release Date: 6/30/2026 |
| Next Release Date: 7/31/2026 |