|
Download Data (XLS File) |
|
||||||||
|
||||||||
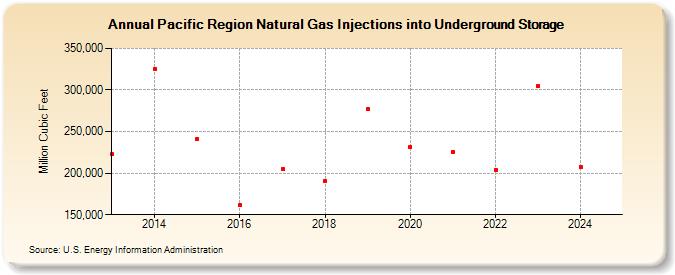
| Pacific Region Natural Gas Injections into Underground Storage (Million Cubic Feet) | ||||||||
| Decade | Year-0 | Year-1 | Year-2 | Year-3 | Year-4 | Year-5 | Year-6 | Year-7 | Year-8 | Year-9 |
|---|---|---|---|---|---|---|---|---|---|---|
| 2010's | 222,430 | 325,432 | 241,625 | 161,913 | 204,892 | 190,298 | 276,787 | |||
| 2020's | 231,499 | 225,751 | 204,279 | 305,222 | 207,644 | 227,705 |
| - = No Data Reported; -- = Not Applicable; NA = Not Available; W = Withheld to avoid disclosure of individual company data. |
| Release Date: 6/30/2026 |
| Next Release Date: 7/31/2026 |