|
Download Data (XLS File) |
|
||||||||
|
||||||||
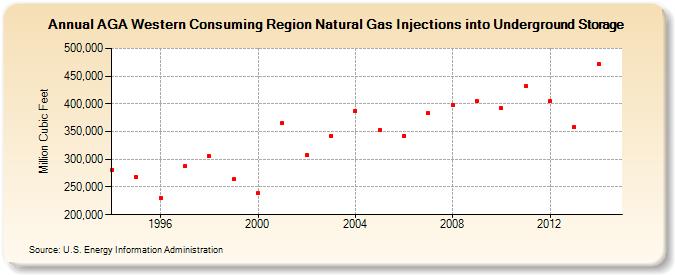
| AGA Western Consuming Region Natural Gas Injections into Underground Storage (Million Cubic Feet) | ||||||||
| Decade | Year-0 | Year-1 | Year-2 | Year-3 | Year-4 | Year-5 | Year-6 | Year-7 | Year-8 | Year-9 |
|---|---|---|---|---|---|---|---|---|---|---|
| 1990's | 281,107 | 267,473 | 230,902 | 287,696 | 305,064 | 263,534 | ||||
| 2000's | 238,359 | 365,373 | 307,480 | 342,710 | 386,953 | 352,022 | 342,567 | 383,856 | 398,173 | 404,441 |
| 2010's | 391,645 | 431,766 | 404,750 | 357,835 | 471,769 |
| - = No Data Reported; -- = Not Applicable; NA = Not Available; W = Withheld to avoid disclosure of individual company data. |
| Release Date: 6/30/2026 |
| Next Release Date: 7/31/2026 |