|
Download Data (XLS File) |
|
||||||||
|
||||||||
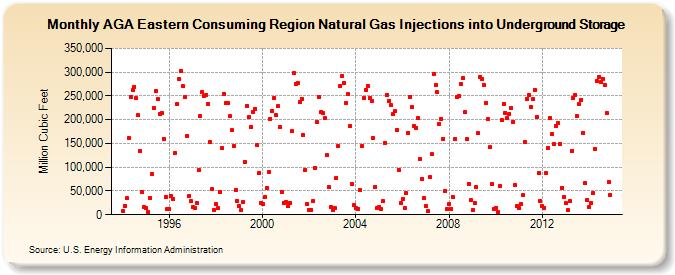
| AGA Eastern Consuming Region Natural Gas Injections into Underground Storage (Million Cubic Feet) | ||||||||
| Year | Jan | Feb | Mar | Apr | May | Jun | Jul | Aug | Sep | Oct | Nov | Dec |
|---|---|---|---|---|---|---|---|---|---|---|---|---|
| 1994 | 7,862 | 17,834 | 34,190 | 160,946 | 247,849 | 262,039 | 269,285 | 244,910 | 208,853 | 134,234 | 47,094 | 16,471 |
| 1995 | 13,614 | 4,932 | 36,048 | 85,712 | 223,991 | 260,731 | 242,718 | 212,493 | 214,385 | 160,007 | 37,788 | 12,190 |
| 1996 | 12,276 | 39,022 | 32,753 | 130,232 | 233,717 | 285,798 | 303,416 | 270,223 | 247,897 | 166,356 | 39,330 | 28,875 |
| 1997 | 16,058 | 14,620 | 25,278 | 93,501 | 207,338 | 258,086 | 250,776 | 252,129 | 233,730 | 152,913 | 53,097 | 10,338 |
| 1998 | 21,908 | 13,334 | 48,068 | 139,412 | 254,837 | 234,427 | 234,269 | 207,026 | 178,129 | 144,203 | 52,518 | 28,342 |
| 1999 | 18,032 | 8,946 | 26,228 | 111,081 | 229,212 | 205,889 | 185,349 | 217,043 | 223,192 | 146,647 | 87,394 | 25,228 |
| 2000 | 23,131 | 36,493 | 56,345 | 89,820 | 201,423 | 219,085 | 245,876 | 208,981 | 228,479 | 184,176 | 47,288 | 25,584 |
| 2001 | 27,232 | 18,182 | 24,762 | 175,266 | 297,600 | 275,445 | 277,518 | 237,351 | 244,484 | 167,547 | 93,665 | 21,944 |
| 2002 | 10,397 | 10,217 | 28,972 | 99,218 | 194,362 | 246,952 | 215,576 | 213,709 | 202,518 | 124,830 | 57,715 | 15,734 |
| 2003 | 9,409 | 13,711 | 78,063 | 143,688 | 271,165 | 292,531 | 277,133 | 235,590 | 253,452 | 186,626 | 64,355 | 19,448 |
| 2004 | 14,079 | 12,302 | 51,140 | 144,117 | 244,985 | 263,415 | 271,279 | 245,751 | 239,125 | 161,088 | 58,456 | 14,616 |
| 2005 | 16,821 | 11,107 | 28,737 | 151,770 | 252,246 | 239,386 | 229,924 | 211,258 | 217,199 | 178,637 | 93,597 | 24,035 |
| 2006 | 32,658 | 13,627 | 44,774 | 172,468 | 248,225 | 226,206 | 186,647 | 182,517 | 202,861 | 117,178 | 75,918 | 34,844 |
| 2007 | 17,895 | 6,800 | 78,462 | 127,159 | 295,734 | 272,346 | 257,496 | 191,794 | 201,742 | 160,359 | 50,388 | 12,810 |
| 2008 | 22,371 | 12,527 | 37,344 | 160,091 | 247,991 | 249,719 | 274,788 | 287,280 | 215,430 | 158,948 | 65,148 | 30,630 |
| 2009 | 9,627 | 24,829 | 58,129 | 171,037 | 290,700 | 285,015 | 273,205 | 235,805 | 200,471 | 141,815 | 64,251 | 12,980 |
| 2010 | 13,968 | 6,329 | 59,727 | 198,279 | 233,519 | 215,048 | 203,744 | 212,060 | 225,561 | 195,985 | 62,319 | 18,327 |
| 2011 | 13,757 | 21,803 | 41,281 | 152,017 | 244,037 | 251,114 | 226,871 | 242,840 | 262,516 | 205,983 | 87,973 | 28,475 |
| 2012 | 18,227 | 14,145 | 86,916 | 140,117 | 203,733 | 169,186 | 148,405 | 187,549 | 193,464 | 148,846 | 57,085 | 37,708 |
| 2013 | 23,659 | 9,716 | 28,107 | 134,762 | 246,561 | 252,813 | 207,284 | 232,870 | 241,485 | 172,422 | 66,678 | 32,005 |
| 2014 | 16,573 | 24,494 | 45,388 | 138,385 | 281,248 | 290,231 | 278,671 | 286,487 | 273,495 | 214,392 | 69,117 | 42,438 |
| - = No Data Reported; -- = Not Applicable; NA = Not Available; W = Withheld to avoid disclosure of individual company data. |
| Release Date: 6/30/2026 |
| Next Release Date: 7/31/2026 |