|
Download Data (XLS File) |
|
||||||||
|
||||||||
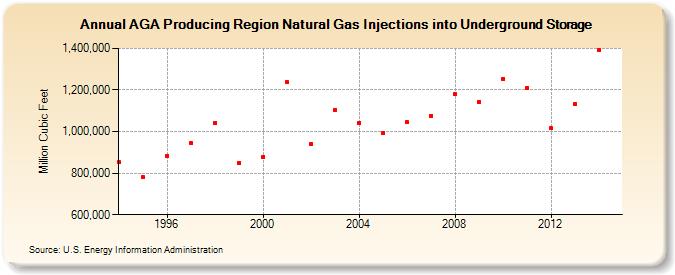
| AGA Producing Region Natural Gas Injections into Underground Storage (Million Cubic Feet) | ||||||||
| Decade | Year-0 | Year-1 | Year-2 | Year-3 | Year-4 | Year-5 | Year-6 | Year-7 | Year-8 | Year-9 |
|---|---|---|---|---|---|---|---|---|---|---|
| 1990's | 851,215 | 779,702 | 884,794 | 944,733 | 1,043,218 | 849,733 | ||||
| 2000's | 879,244 | 1,237,893 | 942,165 | 1,103,834 | 1,042,697 | 994,845 | 1,043,759 | 1,076,080 | 1,179,926 | 1,142,686 |
| 2010's | 1,254,942 | 1,211,381 | 1,015,296 | 1,134,410 | 1,394,463 |
| - = No Data Reported; -- = Not Applicable; NA = Not Available; W = Withheld to avoid disclosure of individual company data. |
| Release Date: 6/30/2026 |
| Next Release Date: 7/31/2026 |