|
Download Data (XLS File) |
|
||||||||
|
||||||||
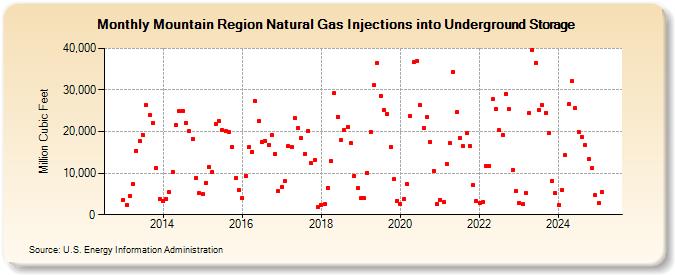
| Mountain Region Natural Gas Injections into Underground Storage (Million Cubic Feet) | ||||||||
| Year | Jan | Feb | Mar | Apr | May | Jun | Jul | Aug | Sep | Oct | Nov | Dec |
|---|---|---|---|---|---|---|---|---|---|---|---|---|
| 2013 | 3,656 | 2,244 | 4,598 | 7,304 | 15,388 | 17,711 | 19,272 | 26,337 | 24,005 | 22,141 | 11,245 | 3,705 |
| 2014 | 3,332 | 3,794 | 5,368 | 10,280 | 21,621 | 24,914 | 25,040 | 22,154 | 20,026 | 18,254 | 8,894 | 5,118 |
| 2015 | 4,951 | 7,712 | 11,554 | 10,291 | 21,721 | 22,466 | 20,404 | 20,025 | 19,990 | 16,279 | 8,918 | 5,903 |
| 2016 | 4,057 | 9,286 | 16,189 | 15,107 | 27,248 | 22,435 | 17,458 | 17,830 | 16,880 | 19,141 | 14,673 | 5,642 |
| 2017 | 6,678 | 8,035 | 16,471 | 16,222 | 23,242 | 20,878 | 18,550 | 14,643 | 20,238 | 12,367 | 13,252 | 1,871 |
| 2018 | 2,412 | 2,492 | 6,489 | 12,826 | 29,257 | 23,588 | 17,900 | 20,386 | 21,089 | 17,133 | 9,422 | 6,348 |
| 2019 | 3,937 | 3,902 | 10,120 | 19,942 | 31,091 | 36,491 | 28,612 | 25,074 | 24,295 | 16,347 | 8,551 | 3,388 |
| 2020 | 2,544 | 3,699 | 7,280 | 23,734 | 36,712 | 36,903 | 26,290 | 20,971 | 23,447 | 17,605 | 10,609 | 2,493 |
| 2021 | 3,581 | 2,998 | 12,205 | 17,237 | 34,412 | 24,597 | 18,418 | 16,469 | 19,624 | 16,506 | 7,118 | 3,208 |
| 2022 | 2,758 | 3,022 | 11,733 | 11,835 | 27,726 | 25,387 | 20,255 | 19,193 | 29,101 | 25,340 | 10,809 | 5,654 |
| 2023 | 2,777 | 2,521 | 5,240 | 24,510 | 39,655 | 36,398 | 25,268 | 26,399 | 24,571 | 19,711 | 8,196 | 5,158 |
| 2024 | 2,294 | 5,960 | 14,249 | 26,545 | 32,146 | 25,578 | 20,010 | 18,768 | 16,755 | 13,309 | 11,177 | 4,727 |
| 2025 | 2,739 | 5,485 | 12,427 | 20,158 | 31,859 | 26,294 | 22,847 | 17,286 | 21,801 | 19,490 | 12,733 | 5,238 |
| 2026 | 3,815 | 8,069 | 19,109 | 19,688 | ||||||||
| - = No Data Reported; -- = Not Applicable; NA = Not Available; W = Withheld to avoid disclosure of individual company data. |
| Release Date: 6/30/2026 |
| Next Release Date: 7/31/2026 |