|
Download Data (XLS File) |
|
||||||||
|
||||||||
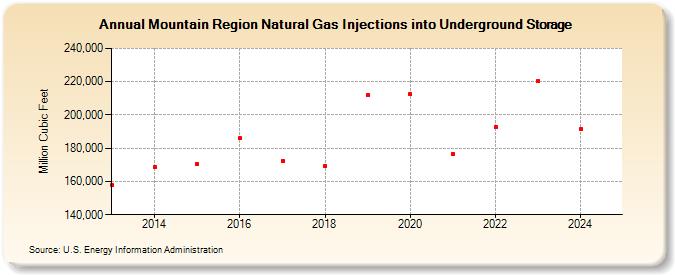
| Mountain Region Natural Gas Injections into Underground Storage (Million Cubic Feet) | ||||||||
| Decade | Year-0 | Year-1 | Year-2 | Year-3 | Year-4 | Year-5 | Year-6 | Year-7 | Year-8 | Year-9 |
|---|---|---|---|---|---|---|---|---|---|---|
| 2010's | 157,608 | 168,796 | 170,215 | 185,945 | 172,448 | 169,342 | 211,751 | |||
| 2020's | 212,288 | 176,374 | 192,812 | 220,403 | 191,517 | 198,355 |
| - = No Data Reported; -- = Not Applicable; NA = Not Available; W = Withheld to avoid disclosure of individual company data. |
| Release Date: 6/30/2026 |
| Next Release Date: 7/31/2026 |