|
Download Data (XLS File) |
|
||||||||
|
||||||||
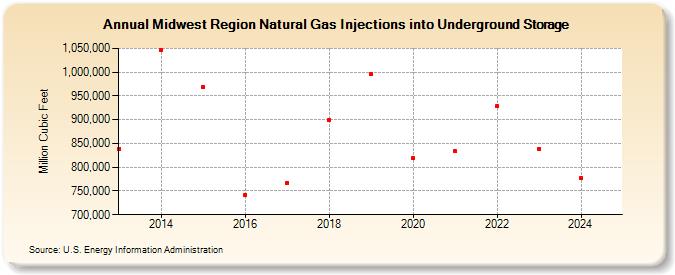
| Midwest Region Natural Gas Injections into Underground Storage (Million Cubic Feet) | ||||||||
| Decade | Year-0 | Year-1 | Year-2 | Year-3 | Year-4 | Year-5 | Year-6 | Year-7 | Year-8 | Year-9 |
|---|---|---|---|---|---|---|---|---|---|---|
| 2010's | 839,195 | 1,046,800 | 968,281 | 741,456 | 767,573 | 899,896 | 995,440 | |||
| 2020's | 818,300 | 833,425 | 928,265 | 838,929 | 777,463 | 941,812 |
| - = No Data Reported; -- = Not Applicable; NA = Not Available; W = Withheld to avoid disclosure of individual company data. |
| Release Date: 5/29/2026 |
| Next Release Date: 6/30/2026 |