|
Download Data (XLS File) |
|
||||||||
|
||||||||
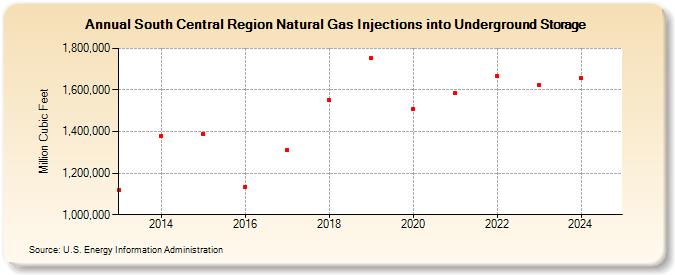
| South Central Region Natural Gas Injections into Underground Storage (Million Cubic Feet) | ||||||||
| Decade | Year-0 | Year-1 | Year-2 | Year-3 | Year-4 | Year-5 | Year-6 | Year-7 | Year-8 | Year-9 |
|---|---|---|---|---|---|---|---|---|---|---|
| 2010's | 1,120,333 | 1,380,453 | 1,387,120 | 1,135,453 | 1,313,376 | 1,550,268 | 1,754,537 | |||
| 2020's | 1,509,935 | 1,583,554 | 1,666,250 | 1,626,552 | 1,658,326 | 1,765,702 |
| - = No Data Reported; -- = Not Applicable; NA = Not Available; W = Withheld to avoid disclosure of individual company data. |
| Release Date: 6/30/2026 |
| Next Release Date: 7/31/2026 |