|
Download Data (XLS File) |
|
||||||||
|
||||||||
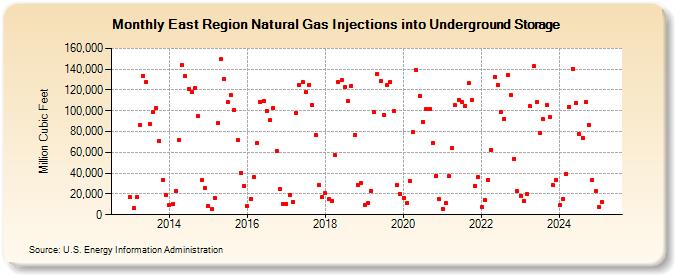
| East Region Natural Gas Injections into Underground Storage (Million Cubic Feet) | ||||||||
| Year | Jan | Feb | Mar | Apr | May | Jun | Jul | Aug | Sep | Oct | Nov | Dec |
|---|---|---|---|---|---|---|---|---|---|---|---|---|
| 2013 | 16,843 | 6,411 | 17,023 | 86,311 | 133,867 | 127,512 | 86,944 | 99,113 | 102,640 | 71,127 | 33,857 | 19,392 |
| 2014 | 9,107 | 10,259 | 22,569 | 71,857 | 144,145 | 132,960 | 120,491 | 118,493 | 122,207 | 94,669 | 33,103 | 25,810 |
| 2015 | 8,399 | 5,034 | 16,192 | 88,291 | 149,749 | 130,181 | 108,902 | 114,713 | 101,145 | 71,500 | 40,008 | 27,824 |
| 2016 | 8,145 | 15,477 | 35,993 | 68,950 | 108,777 | 109,671 | 100,101 | 90,867 | 102,521 | 60,862 | 25,137 | 10,723 |
| 2017 | 10,548 | 19,058 | 12,442 | 97,653 | 124,971 | 127,546 | 117,805 | 125,065 | 105,530 | 77,098 | 29,032 | 16,643 |
| 2018 | 20,495 | 14,810 | 13,633 | 57,291 | 127,579 | 129,311 | 122,645 | 108,961 | 123,986 | 76,635 | 28,167 | 30,607 |
| 2019 | 9,575 | 10,852 | 23,227 | 99,024 | 135,687 | 128,409 | 95,924 | 124,516 | 127,804 | 99,345 | 28,342 | 20,347 |
| 2020 | 16,047 | 11,306 | 32,214 | 79,204 | 139,597 | 114,633 | 89,507 | 101,364 | 101,703 | 69,148 | 37,368 | 14,742 |
| 2021 | 5,903 | 11,008 | 36,959 | 64,157 | 105,251 | 110,819 | 108,369 | 104,981 | 126,593 | 110,236 | 27,676 | 35,992 |
| 2022 | 7,344 | 14,167 | 33,719 | 62,636 | 132,680 | 124,636 | 98,383 | 92,156 | 134,626 | 115,148 | 53,934 | 22,396 |
| 2023 | 18,156 | 13,019 | 19,749 | 104,229 | 142,611 | 108,355 | 78,557 | 91,758 | 105,091 | 94,216 | 28,126 | 33,424 |
| 2024 | 9,239 | 14,787 | 39,621 | 104,025 | 140,459 | 107,161 | 77,303 | 73,693 | 108,379 | 86,713 | 33,338 | 22,437 |
| 2025 | 7,778 | 12,695 | 48,353 | 96,129 | 155,904 | 116,508 | 76,737 | 106,472 | 111,661 | 82,992 | 35,642 | 17,358 |
| 2026 | 9,304 | 14,657 | 51,184 | 111,035 | ||||||||
| - = No Data Reported; -- = Not Applicable; NA = Not Available; W = Withheld to avoid disclosure of individual company data. |
| Release Date: 6/30/2026 |
| Next Release Date: 7/31/2026 |