|
Download Data (XLS File) |
|
|||||
|
|||||
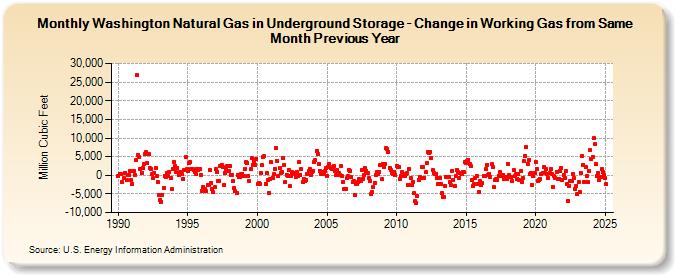
| Washington Natural Gas in Underground Storage - Change in Working Gas from Same Month Previous Year (Million Cubic Feet) | |||||
| Year | Jan | Feb | Mar | Apr | May | Jun | Jul | Aug | Sep | Oct | Nov | Dec |
|---|---|---|---|---|---|---|---|---|---|---|---|---|
| 1990 | -72 | 452 | 283 | -1,858 | -801 | 699 | -1,353 | 41 | 108 | 1,167 | -1,339 | |
| 1991 | -2,326 | 1,196 | 205 | 3,977 | 26,799 | 5,575 | 4,775 | 1,778 | 703 | 1,958 | 2,917 | 5,687 |
| 1992 | 6,208 | 3,332 | 5,695 | 1,986 | 1,815 | 275 | -839 | 679 | 1,880 | -138 | -1,840 | -5,179 |
| 1993 | -6,689 | -7,057 | -5,245 | -3,367 | -188 | -497 | 627 | -212 | 975 | -626 | -3,745 | 1,760 |
| 1994 | 3,597 | 2,471 | 806 | 1,906 | -20 | 879 | 539 | 371 | -878 | 1,499 | 4,890 | 1,609 |
| 1995 | 1,078 | 3,321 | 3,503 | 1,633 | 1,599 | 1,386 | 990 | 268 | 1,628 | 1,312 | 1,767 | -15 |
| 1996 | -4,203 | -3,033 | -3,595 | -3,720 | -4,328 | -2,562 | -2,690 | 1,336 | -2,014 | -3,767 | -4,591 | -3,144 |
| 1997 | 1,694 | 956 | -1,465 | -1,508 | 2,410 | 2,858 | 2,185 | -2,562 | 562 | 1,707 | 2,374 | 1,107 |
| 1998 | 2,518 | 168 | 76 | -1,559 | -3,507 | -4,323 | -4,622 | 9 | -436 | -434 | 416 | 367 |
| 1999 | -164 | 1,737 | 3,657 | 3,274 | -102 | -1,594 | 1,620 | 4,518 | 2,696 | 3,821 | 2,767 | 4,310 |
| 2000 | -2,294 | -2,095 | -2,210 | 634 | 2,646 | 4,849 | 5,061 | -2,266 | 567 | -1,225 | -4,740 | -1,094 |
| 2001 | 3,503 | -593 | 342 | 1,716 | 7,412 | 3,940 | -170 | 1,948 | 549 | 966 | 4,615 | 2,669 |
| 2002 | -1,774 | 160 | -128 | 1,414 | -2,820 | -110 | 869 | 709 | 360 | -467 | 931 | -283 |
| 2003 | 3,491 | 145 | 1,580 | -1,842 | -990 | -1,549 | -1,389 | 335 | 1,139 | 1,605 | 144 | 783 |
| 2004 | 1,199 | 3,601 | 4,020 | 6,624 | 5,778 | 3,163 | 1,246 | 303 | 884 | 407 | 1,051 | 1,923 |
| 2005 | -126 | 2,319 | 3,054 | 1,932 | 1,764 | 2,242 | 2,497 | 1,048 | 174 | 1,414 | 565 | 60 |
| 2006 | 2,361 | -282 | -1,765 | -3,722 | -3,653 | -821 | -252 | 1,436 | 1,178 | -540 | -1,861 | -1,579 |
| 2007 | -5,324 | -2,367 | -2,434 | -1,669 | -1,078 | -1,501 | 1,526 | -924 | 157 | 1,833 | 1,193 | 651 |
| 2008 | -741 | -1,532 | -5,116 | -4,584 | -3,258 | -1,940 | 95 | 1,004 | 266 | 887 | 2,664 | -1,104 |
| 2009 | 3,050 | 2,166 | 3,075 | 7,190 | 6,940 | 6,183 | 2,057 | 1,480 | 745 | 427 | 981 | 99 |
| 2010 | 2,520 | 2,146 | 2,311 | -1,114 | -94 | 806 | 77 | -321 | 405 | 661 | -2,537 | 1,781 |
| 2011 | -664 | -2,495 | -1,900 | -4,871 | -6,995 | -7,396 | -5,509 | -1,311 | -567 | -637 | 2,353 | 2,098 |
| 2012 | -709 | 808 | 3,271 | 6,181 | 6,088 | 6,383 | 4,711 | 1,318 | 684 | 419 | 429 | -794 |
| 2013 | -2,469 | -641 | -2,259 | -4,764 | -5,797 | -5,838 | -2,813 | -504 | -549 | -369 | -1,772 | -2,734 |
| 2014 | 1,145 | -1,183 | -2,974 | -218 | 1,439 | 957 | -635 | 654 | 441 | 863 | 969 | 3,514 |
| 2015 | 3,319 | 3,895 | 4,046 | 3,157 | 2,462 | -1,143 | -2,950 | -2,281 | -747 | -154 | -2,386 | -4,419 |
| 2016 | -1,484 | -2,626 | -2,041 | -322 | -267 | 1,729 | 2,795 | 139 | 347 | -369 | 2,971 | 2,216 |
| 2017 | -3,213 | -1,380 | -1,001 | -1,324 | -92 | 813 | -304 | -170 | 208 | -1,103 | -484 | -1,072 |
| 2018 | 2,941 | 201 | -449 | -499 | -1,561 | 1,371 | -154 | 254 | -909 | 290 | -1,274 | 1,081 |
| 2019 | -1,696 | -803 | 3,737 | 5,290 | 7,531 | 3,159 | 4,038 | 237 | 580 | -2,485 | -280 | 656 |
| 2020 | 3,660 | 1,803 | -1,581 | -1,221 | -1,056 | 356 | 639 | 2,105 | 555 | 1,603 | 469 | -713 |
| 2021 | 671 | 1,606 | 224 | -3,140 | -195 | -708 | 964 | -867 | -885 | 1,256 | 1,910 | -1,301 |
| 2022 | -39 | -627 | 1,149 | -2,406 | -6,962 | -2,765 | -1,542 | -1,572 | 339 | -770 | -3,807 | -2,876 |
| 2023 | -5,118 | -1,834 | -4,427 | 710 | 5,302 | 2,848 | -1,685 | 2,285 | -115 | -1,796 | 1,221 | 6,675 |
| 2024 | 4,497 | 4,924 | 9,997 | 8,292 | 2,940 | -298 | 647 | -1,179 | -563 | 1,673 | 983 | 83 |
| 2025 | -665 | -2,446 | -2,820 | -123 | -2,852 | -1,272 | 1,080 | 19 | 210 | -350 | 596 | -1,094 |
| 2026 | 47 | 2,290 | -384 | -2,729 | ||||||||
| - = No Data Reported; -- = Not Applicable; NA = Not Available; W = Withheld to avoid disclosure of individual company data. |
| Release Date: 6/30/2026 |
| Next Release Date: 7/31/2026 |