|
Download Data (XLS File) |
|
|||||
|
|||||
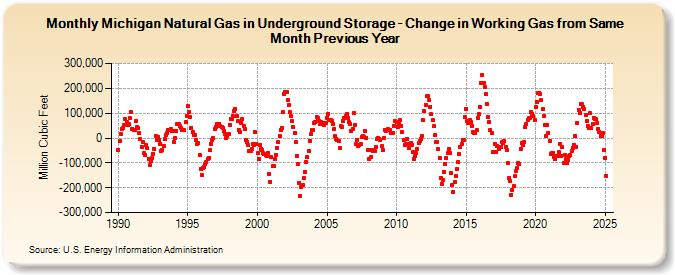
| Michigan Natural Gas in Underground Storage - Change in Working Gas from Same Month Previous Year (Million Cubic Feet) | |||||
| Year | Jan | Feb | Mar | Apr | May | Jun | Jul | Aug | Sep | Oct | Nov | Dec |
|---|---|---|---|---|---|---|---|---|---|---|---|---|
| 1990 | -46,336 | -12,518 | 16,386 | 37,537 | 39,350 | 53,475 | 75,155 | 66,399 | 51,354 | 56,272 | 78,572 | 103,458 |
| 1991 | 37,515 | 32,421 | 33,438 | 66,819 | 45,861 | 39,009 | 20,626 | -3,335 | -36,217 | -14,370 | -61,674 | -66,823 |
| 1992 | -28,428 | -40,296 | -82,921 | -108,640 | -91,199 | -80,473 | -64,200 | -42,476 | 6,226 | -6,558 | 5,238 | -8,047 |
| 1993 | -24,044 | -50,720 | -46,230 | -30,890 | -2,151 | 10,891 | 18,951 | 32,973 | 30,570 | 35,656 | 29,996 | 29,256 |
| 1994 | -14,259 | -863 | 29,447 | 55,468 | 54,681 | 47,879 | 39,379 | 33,787 | 33,353 | 30,952 | 63,383 | 90,351 |
| 1995 | 128,802 | 104,986 | 84,297 | 42,019 | 22,263 | 13,284 | 13,257 | -9,804 | -23,078 | -21,919 | -68,301 | -123,990 |
| 1996 | -149,332 | -118,974 | -118,067 | -102,965 | -97,954 | -84,593 | -78,567 | -49,738 | -22,914 | -6,286 | -1,039 | 34,348 |
| 1997 | 44,315 | 55,911 | 52,821 | 57,900 | 47,257 | 43,106 | 39,718 | 30,213 | 16,407 | 872 | 9,447 | 15,843 |
| 1998 | 53,314 | 77,644 | 75,080 | 87,746 | 109,785 | 116,378 | 88,018 | 67,227 | 32,303 | 25,915 | 59,534 | 75,832 |
| 1999 | 47,292 | 36,151 | -7,612 | -14,982 | -29,723 | -52,925 | -50,329 | -44,470 | -23,742 | -26,154 | 23,482 | -23,977 |
| 2000 | -61,469 | -82,781 | -27,424 | -43,210 | -49,672 | -62,173 | -63,589 | -68,705 | -72,449 | -60,462 | -145,365 | -175,111 |
| 2001 | -78,050 | -113,267 | -111,897 | -85,475 | -67,522 | -40,412 | -17,813 | 8,331 | 33,740 | 41,926 | 103,814 | 176,527 |
| 2002 | 185,614 | 186,478 | 154,642 | 134,717 | 102,939 | 88,561 | 67,576 | 42,531 | 19,408 | -16,455 | -70,456 | -103,051 |
| 2003 | -180,026 | -232,666 | -195,273 | -189,389 | -162,571 | -136,265 | -95,366 | -78,321 | -54,150 | -10,841 | 15,090 | 32,314 |
| 2004 | 32,429 | 62,415 | 66,315 | 85,084 | 81,577 | 67,939 | 54,889 | 65,073 | 61,922 | 52,373 | 61,511 | 60,005 |
| 2005 | 82,112 | 98,344 | 72,003 | 72,586 | 70,289 | 57,892 | 36,111 | 7,490 | -4,983 | -8,074 | -12,066 | -40,748 |
| 2006 | 47,235 | 46,280 | 69,838 | 80,172 | 88,671 | 97,447 | 80,929 | 64,019 | 57,990 | 29,420 | 37,350 | 100,707 |
| 2007 | 53,282 | -22,103 | -7,273 | -33,782 | -29,678 | -23,262 | 3,407 | 9,915 | 4,588 | 27,375 | 1,850 | -48,622 |
| 2008 | -84,243 | -48,702 | -78,039 | -49,498 | -52,109 | -50,608 | -37,835 | -5,833 | 1,713 | -4,736 | -7,977 | -30,680 |
| 2009 | -46,703 | 628 | 34,001 | 27,827 | 31,681 | 34,967 | 33,079 | 21,435 | 21,567 | 18,762 | 49,512 | 68,186 |
| 2010 | 62,488 | 45,621 | 57,137 | 73,221 | 49,678 | 25,959 | -9,808 | -27,564 | -22,126 | -2,576 | -25,726 | -41,795 |
| 2011 | -21,384 | -28,315 | -55,486 | -82,432 | -71,621 | -60,929 | -43,721 | -20,663 | -10,247 | -3,896 | 10,089 | 71,336 |
| 2012 | 106,740 | 134,897 | 167,202 | 168,910 | 152,752 | 125,500 | 95,525 | 72,251 | 47,125 | 10,190 | -15,072 | -14,542 |
| 2013 | -44,624 | -80,071 | -160,821 | -185,658 | -168,489 | -136,714 | -103,774 | -81,553 | -61,522 | -44,363 | -59,080 | -140,387 |
| 2014 | -191,028 | -215,987 | -177,433 | -154,312 | -125,855 | -97,890 | -63,628 | -38,119 | -24,580 | -9,609 | -6,939 | 83,122 |
| 2015 | 116,849 | 69,635 | 59,986 | 71,789 | 62,817 | 47,390 | 25,058 | 21,959 | 18,206 | 31,809 | 79,508 | 95,361 |
| 2016 | 125,998 | 221,529 | 252,480 | 223,347 | 206,679 | 176,879 | 137,739 | 85,023 | 64,603 | 33,156 | 19,629 | -57,524 |
| 2017 | -57,918 | -24,552 | -58,093 | -32,058 | -42,339 | -37,694 | -34,746 | -16,946 | -19,351 | -12,622 | -34,904 | -47,599 |
| 2018 | -100,421 | -160,477 | -174,794 | -228,269 | -210,324 | -191,619 | -153,991 | -134,153 | -121,165 | -101,094 | -105,920 | -43,552 |
| 2019 | -20,827 | -28,785 | -14,746 | 42,908 | 56,598 | 74,509 | 79,202 | 81,854 | 102,888 | 98,671 | 88,102 | 73,543 |
| 2020 | 123,962 | 143,949 | 180,977 | 182,776 | 175,350 | 151,614 | 116,160 | 88,468 | 52,489 | 7,379 | 51,945 | 21,439 |
| 2021 | -10,186 | -66,056 | -61,026 | -61,963 | -75,998 | -85,026 | -74,273 | -71,490 | -57,660 | -22,657 | -71,650 | -37,913 |
| 2022 | -100,212 | -68,751 | -84,764 | -102,420 | -87,772 | -70,380 | -68,788 | -53,402 | -39,543 | -26,289 | 7,317 | -35,568 |
| 2023 | 61,139 | 114,268 | 99,623 | 135,960 | 134,919 | 126,539 | 118,345 | 91,890 | 69,049 | 46,540 | 39,392 | 98,885 |
| 2024 | 39,574 | 56,778 | 81,601 | 78,521 | 75,519 | 61,345 | 37,336 | 25,547 | 8,580 | 8,290 | 21,531 | -46,841 |
| 2025 | -78,826 | -151,453 | -132,575 | -127,629 | -110,391 | -92,660 | -67,336 | -41,961 | -22,193 | -14,890 | -32,739 | -62,186 |
| 2026 | -37,047 | -11,243 | -21,881 | -8,241 | ||||||||
| - = No Data Reported; -- = Not Applicable; NA = Not Available; W = Withheld to avoid disclosure of individual company data. |
| Release Date: 6/30/2026 |
| Next Release Date: 7/31/2026 |