|
Download Data (XLS File) |
|
|||||
|
|||||
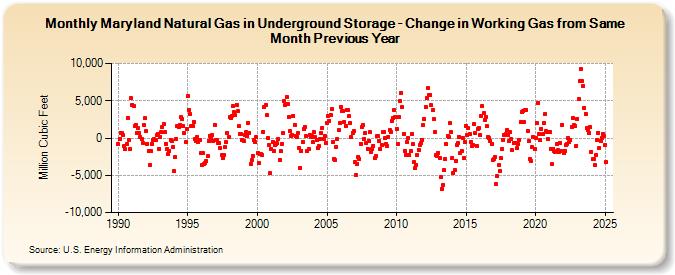
| Maryland Natural Gas in Underground Storage - Change in Working Gas from Same Month Previous Year (Million Cubic Feet) | |||||
| Year | Jan | Feb | Mar | Apr | May | Jun | Jul | Aug | Sep | Oct | Nov | Dec |
|---|---|---|---|---|---|---|---|---|---|---|---|---|
| 1990 | -862 | -85 | 724 | 658 | 416 | -1,091 | -1,477 | -807 | 2,724 | -222 | -1,505 | 5,333 |
| 1991 | 4,470 | 4,339 | 1,613 | 1,801 | 727 | 1,324 | 628 | 202 | -123 | -686 | 1,727 | 2,620 |
| 1992 | 900 | -745 | -1,784 | -3,603 | -1,779 | -745 | -328 | -176 | -219 | 356 | 579 | -1,431 |
| 1993 | 153 | 742 | 1,488 | 1,891 | 777 | -736 | -1,464 | -2,133 | -1,700 | -270 | -379 | -1,170 |
| 1994 | -4,444 | -2,565 | -113 | 1,629 | 1,482 | 1,771 | 2,779 | 2,519 | 1,569 | 658 | -517 | 1,249 |
| 1995 | 5,583 | 3,808 | 3,166 | 1,674 | 1,629 | 2,195 | -93 | -369 | 129 | -488 | -247 | -2,056 |
| 1996 | -3,630 | -2,064 | -3,459 | -3,286 | -3,097 | -2,473 | -372 | 315 | -34 | 394 | -346 | 1,808 |
| 1997 | -278 | -264 | -667 | -728 | -1,328 | -2,326 | -2,741 | -2,319 | -1,251 | -548 | 673 | 148 |
| 1998 | 2,785 | 2,702 | 2,975 | 4,234 | 3,452 | 3,047 | 4,474 | 3,589 | 1,606 | 589 | 519 | -237 |
| 1999 | -399 | 364 | 786 | 326 | 2,069 | 725 | -3,522 | -2,976 | -2,348 | -238 | -573 | 78 |
| 2000 | -2,004 | -3,406 | -2,132 | -2,166 | -2,256 | 836 | 4,161 | 4,442 | 3,075 | -17 | -904 | -4,732 |
| 2001 | -1,486 | -484 | -1,764 | -995 | -803 | -705 | -134 | -2,887 | -1,765 | -740 | 640 | 4,952 |
| 2002 | 4,465 | 5,495 | 4,588 | 2,760 | 887 | 293 | 339 | 2,962 | 1,752 | 299 | 185 | 701 |
| 2003 | -1,315 | -3,966 | -1,720 | -544 | 1,211 | 1,523 | 268 | -1,727 | -1,523 | 435 | 94 | 224 |
| 2004 | -574 | 768 | 122 | -291 | -1,291 | -1,066 | -73 | 641 | 1,381 | -96 | 284 | -690 |
| 2005 | 2,080 | 2,937 | 2,302 | 3,093 | 3,900 | -475 | -2,754 | -2,907 | -1,154 | -138 | 1,033 | 2,036 |
| 2006 | 4,218 | 3,643 | 3,653 | 2,181 | 1,637 | 3,768 | 3,821 | 2,930 | 2,009 | 170 | 698 | 939 |
| 2007 | -3,192 | -4,976 | -3,425 | -2,480 | -2,785 | -764 | 1,526 | 1,778 | -119 | 716 | -657 | -1,410 |
| 2008 | -420 | 773 | -1,906 | -1,422 | -1,008 | -2,670 | -2,400 | 231 | 219 | -424 | -1,518 | -927 |
| 2009 | 763 | 839 | -19 | -746 | -1,087 | 155 | 1,037 | 864 | 2,338 | 2,718 | 3,711 | 2,758 |
| 2010 | 1,277 | -759 | 2,874 | 4,937 | 6,055 | 4,149 | 604 | -1,714 | -2,273 | -600 | 16 | -2,292 |
| 2011 | -1,767 | 557 | -812 | -3,255 | -4,058 | -3,644 | -2,252 | -1,606 | -952 | -733 | -221 | 1,720 |
| 2012 | 2,485 | 4,193 | 5,368 | 6,690 | 5,771 | 5,829 | 4,385 | 3,791 | 2,521 | 860 | -2,328 | -2,383 |
| 2013 | -1,945 | -2,647 | -5,232 | -6,819 | -6,291 | -4,324 | -2,841 | -810 | 259 | 132 | 1,989 | 811 |
| 2014 | -2,642 | -4,729 | -4,293 | -3,028 | -904 | -657 | 192 | -2,076 | -1,675 | 54 | -2,692 | -556 |
| 2015 | 1,627 | 437 | 1,310 | 585 | -480 | -1,082 | -950 | 1,850 | 632 | -1,025 | 1,249 | 1,328 |
| 2016 | 393 | 2,976 | 4,288 | 3,318 | 2,443 | 2,887 | 1,581 | 192 | -30 | -426 | -829 | -2,916 |
| 2017 | -2,839 | -2,594 | -6,106 | -5,111 | -3,654 | -4,435 | -2,696 | -1,467 | -223 | 444 | 521 | 1,045 |
| 2018 | 469 | -443 | 744 | -190 | -1,656 | -651 | -620 | -648 | -1,391 | -825 | -297 | 2,128 |
| 2019 | 3,483 | 3,610 | 2,113 | 3,811 | 3,796 | 945 | -460 | -2,812 | -3,035 | -1,234 | 200 | -1,515 |
| 2020 | 12 | 2,010 | 4,700 | 574 | -204 | 1,246 | 526 | 2,040 | 3,211 | 935 | 758 | -157 |
| 2021 | 813 | -1,414 | -3,534 | -1,413 | -1,784 | -1,854 | -844 | -1,669 | -1,899 | -649 | -1,798 | 1,803 |
| 2022 | -1,956 | -1,695 | -886 | -791 | -57 | -530 | -260 | 1,519 | 2,723 | 1,746 | 1,624 | -1,023 |
| 2023 | 2,603 | 5,228 | 7,587 | 9,288 | 7,628 | 7,019 | 4,038 | 3,284 | 1,326 | 1,023 | 738 | 1,470 |
| 2024 | -1,826 | -2,858 | -2,758 | -3,659 | -2,319 | -259 | 709 | -1,283 | -336 | 3 | 554 | 255 |
| 2025 | -936 | -3,234 | -3,827 | -2,738 | -442 | -1,464 | -2,201 | -1,322 | -894 | -1,020 | -453 | 249 |
| 2026 | 447 | -47 | -1,697 | -2,360 | ||||||||
| - = No Data Reported; -- = Not Applicable; NA = Not Available; W = Withheld to avoid disclosure of individual company data. |
| Release Date: 6/30/2026 |
| Next Release Date: 7/31/2026 |