|
Download Data (XLS File) |
|
|||||
|
|||||
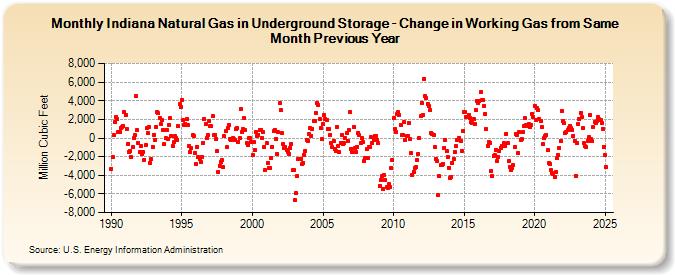
| Indiana Natural Gas in Underground Storage - Change in Working Gas from Same Month Previous Year (Million Cubic Feet) | |||||
| Year | Jan | Feb | Mar | Apr | May | Jun | Jul | Aug | Sep | Oct | Nov | Dec |
|---|---|---|---|---|---|---|---|---|---|---|---|---|
| 1990 | -3,295 | -2,048 | 303 | 1,673 | 2,267 | 2,054 | 632 | 690 | 1,081 | 1,169 | 1,343 | 2,765 |
| 1991 | 2,450 | 1,002 | -617 | -1,537 | -1,372 | -2,052 | -995 | -41 | 274 | 4,477 | 815 | -517 |
| 1992 | -1,493 | -820 | -1,663 | -1,510 | -2,353 | -796 | 1,038 | 506 | 1,229 | -2,650 | -2,283 | -922 |
| 1993 | 374 | -217 | 1,229 | 2,820 | 2,636 | 2,160 | 1,462 | 1,893 | 876 | -679 | -25 | 903 |
| 1994 | -79 | 1,426 | 2,111 | 236 | -856 | -462 | 215 | -22 | -226 | 1,272 | 3,701 | 3,372 |
| 1995 | 4,108 | 1,921 | 1,440 | 1,503 | 2,033 | 1,379 | -847 | -1,547 | -1,105 | 305 | 239 | -1,594 |
| 1996 | -2,809 | -931 | -2,059 | -2,296 | -2,608 | -2,010 | -508 | 2,016 | 1,499 | -9 | 283 | 1,806 |
| 1997 | 1,273 | 1,258 | 2,321 | 318 | 361 | -122 | -1,424 | -3,651 | -2,975 | -2,544 | -2,387 | -3,130 |
| 1998 | 167 | 740 | -1,002 | 1,030 | 1,406 | -65 | -203 | -51 | -108 | -262 | 1,016 | 1,025 |
| 1999 | -394 | -1 | 3,092 | 626 | 948 | 2,130 | 844 | -490 | -799 | -25 | -33 | -389 |
| 2000 | -1,874 | -392 | -1,277 | 691 | 190 | 305 | 864 | 877 | 17 | 601 | -971 | -3,482 |
| 2001 | -563 | -2,659 | -3,182 | -3,193 | -2,112 | -917 | 716 | 896 | -98 | -1,686 | 601 | 3,716 |
| 2002 | 2,993 | 517 | -622 | -1,121 | -1,011 | -1,300 | -1,462 | -1,685 | -1,063 | -613 | -3,484 | -3,483 |
| 2003 | -6,667 | -5,948 | -4,088 | -2,276 | -2,209 | -2,230 | -2,840 | -2,637 | -1,819 | -1,347 | -180 | -312 |
| 2004 | 454 | 1,050 | 246 | 1,021 | 1,806 | 1,864 | 2,700 | 3,791 | 3,565 | 2,048 | 1,035 | -112 |
| 2005 | 1,466 | 2,493 | 2,052 | 1,931 | 952 | 983 | 341 | -586 | -955 | -322 | -1,131 | -1,417 |
| 2006 | 1,214 | -833 | -1,529 | -482 | 361 | -602 | -582 | 0 | 525 | -311 | 869 | 2,799 |
| 2007 | -1,151 | -1,507 | 1,202 | -1,069 | -1,532 | -933 | 566 | 275 | -549 | 17 | -408 | -2,434 |
| 2008 | -2,169 | -1,196 | -2,170 | -934 | -994 | 78 | -563 | -172 | 253 | 216 | -205 | -570 |
| 2009 | -5,130 | -4,496 | -4,122 | -5,450 | -4,000 | -4,515 | -5,298 | -5,402 | -4,967 | -5,248 | -3,171 | -2,327 |
| 2010 | 2,100 | 945 | 617 | 2,530 | 2,791 | 2,489 | 1,425 | 272 | 360 | 1,717 | -228 | 219 |
| 2011 | 244 | 1,593 | -158 | -1,611 | -3,946 | -3,613 | -3,243 | -3,135 | -2,411 | -1,699 | 1 | 2,319 |
| 2012 | 3,741 | 2,490 | 6,366 | 4,460 | 4,275 | 3,686 | 3,457 | 2,977 | 581 | 428 | 352 | -950 |
| 2013 | -2,223 | -2,421 | -6,145 | -4,126 | -2,948 | -2,927 | -2,773 | -1,025 | -212 | -1,422 | -2,035 | -3,179 |
| 2014 | -4,335 | -4,133 | -2,649 | -2,234 | -1,487 | -893 | -185 | -204 | 49 | -293 | -1,364 | 728 |
| 2015 | 2,750 | 2,781 | 2,239 | 2,276 | 2,433 | 2,200 | 1,760 | 1,604 | 2,031 | 1,518 | 3,001 | 3,981 |
| 2016 | 3,736 | 3,953 | 4,911 | 4,051 | 4,056 | 3,433 | 2,598 | 951 | -832 | -380 | -482 | -3,551 |
| 2017 | -4,112 | -1,908 | -1,774 | -1,239 | -2,485 | -2,024 | -1,404 | -1,076 | -823 | -855 | -562 | -803 |
| 2018 | 479 | -569 | -2,513 | -3,062 | -3,480 | -3,257 | -2,924 | -949 | 406 | 347 | -1,622 | 642 |
| 2019 | -209 | -87 | 615 | 1,255 | 2,099 | 1,349 | 1,269 | 1,471 | 1,200 | 1,449 | 2,630 | 2,278 |
| 2020 | 3,466 | 1,888 | 3,194 | 2,998 | 2,061 | 1,850 | 1,176 | -663 | -38 | 199 | 362 | -1,246 |
| 2021 | -2,725 | -2,788 | -3,458 | -3,770 | -3,866 | -4,138 | -3,599 | -2,131 | -1,852 | -1,025 | -279 | 2,910 |
| 2022 | 1,806 | 1,579 | 520 | 618 | 842 | 1,107 | 1,332 | 1,109 | 886 | 259 | -324 | -4,031 |
| 2023 | -561 | 1,501 | 2,053 | 2,718 | 2,269 | 1,028 | -575 | -902 | -964 | -284 | 64 | 2,474 |
| 2024 | -152 | -372 | 1,179 | 1,676 | 1,654 | 1,827 | 2,213 | 1,993 | 1,885 | 1,583 | 1,005 | -933 |
| 2025 | -1,837 | -3,160 | -3,773 | -4,141 | -2,886 | -1,784 | -920 | -185 | 175 | -245 | -502 | 283 |
| 2026 | 1,170 | 2,203 | 2,438 | 2,323 | ||||||||
| - = No Data Reported; -- = Not Applicable; NA = Not Available; W = Withheld to avoid disclosure of individual company data. |
| Release Date: 6/30/2026 |
| Next Release Date: 7/31/2026 |