|
Download Data (XLS File) |
|
|||||
|
|||||
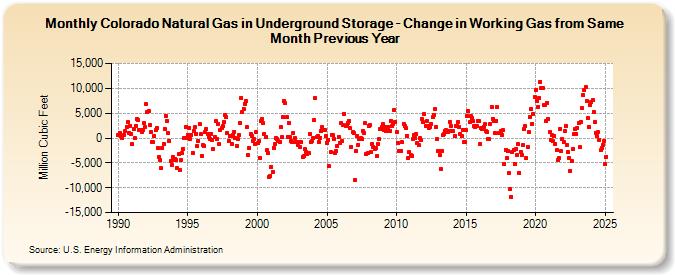
| Colorado Natural Gas in Underground Storage - Change in Working Gas from Same Month Previous Year (Million Cubic Feet) | |||||
| Year | Jan | Feb | Mar | Apr | May | Jun | Jul | Aug | Sep | Oct | Nov | Dec |
|---|---|---|---|---|---|---|---|---|---|---|---|---|
| 1990 | 701 | 995 | 446 | 26 | 639 | 1,368 | 2,249 | 3,219 | 1,102 | 2,496 | 892 | |
| 1991 | -1,225 | 1,811 | 40 | 2,493 | 3,883 | 3,621 | 1,685 | 1,583 | 1,282 | 1,616 | 2,927 | 2,233 |
| 1992 | 6,816 | 5,146 | 5,417 | 2,679 | 1,253 | -728 | -859 | 310 | 1,516 | 2,085 | -2,078 | -3,827 |
| 1993 | -4,453 | -6,128 | -1,947 | -1,204 | 1,853 | 4,502 | 3,520 | 1,087 | -522 | -4,673 | -5,378 | -3,812 |
| 1994 | -4,380 | -4,192 | -4,417 | -6,105 | -3,313 | -6,446 | -4,523 | -3,052 | -2,203 | 74 | 2,261 | 53 |
| 1995 | 699 | 2,115 | -131 | 605 | -2,947 | 1,448 | 2,167 | 881 | -1,537 | -592 | 2,731 | 756 |
| 1996 | -3,583 | -1,460 | -1,587 | 1,297 | 1,828 | 892 | 223 | -114 | 831 | -332 | -2,174 | 183 |
| 1997 | 3,359 | -125 | 2,911 | -1,164 | 1,681 | 1,967 | 2,368 | 3,176 | 4,638 | 4,144 | 998 | -629 |
| 1998 | 362 | 385 | -1,291 | 666 | 1,286 | -19 | -1,545 | -190 | 581 | 2,999 | 8,124 | 5,332 |
| 1999 | 5,875 | 6,945 | 7,430 | 2,161 | -3,481 | -1,956 | 772 | 364 | -674 | -216 | -1,188 | 1,126 |
| 2000 | -1,082 | -667 | -3,993 | 3,507 | 3,832 | 2,966 | 849 | 173 | -2,511 | -2,980 | -7,838 | -7,589 |
| 2001 | -5,785 | -6,805 | -2,007 | -1,285 | -2 | -202 | -643 | -704 | 2,219 | 113 | 4,162 | 7,491 |
| 2002 | 6,993 | 4,186 | 207 | 3,088 | 130 | -649 | -883 | 1,079 | -23 | -727 | -833 | -1,413 |
| 2003 | -752 | -1,820 | -838 | -3,781 | -3,707 | -2,284 | -2,777 | -3,296 | -3,074 | 890 | -883 | -690 |
| 2004 | 59 | 3,616 | 8,007 | 166 | 492 | -786 | 102 | 1,406 | 2,177 | 1,692 | 1,613 | 388 |
| 2005 | -948 | -307 | -5,705 | -2,780 | 650 | 586 | -107 | -2,917 | -2,612 | -1,563 | 166 | -928 |
| 2006 | 3,009 | -603 | 2,604 | 4,894 | 2,498 | 2,540 | 3,115 | 3,472 | 1,922 | -1,777 | 1,136 | 931 |
| 2007 | -8,450 | -2,580 | 377 | -1,329 | -106 | -80 | -136 | 1,453 | 1,091 | 2,942 | -3,258 | -3,107 |
| 2008 | 2,488 | 2,596 | -2,871 | -1,177 | -1,806 | -2,233 | -2,061 | -3,665 | -1,135 | -259 | 1,914 | 2,124 |
| 2009 | 2,745 | 1,540 | 2,224 | 1,425 | 1,803 | 2,188 | 1,456 | 3,522 | 2,453 | 2,859 | 5,667 | 3,238 |
| 2010 | 1,158 | -957 | -2,556 | -2,662 | -2,616 | -878 | 2,906 | 2,504 | 1,938 | 507 | -4,035 | -2,793 |
| 2011 | -3,434 | -3,547 | -191 | 584 | 64 | 770 | -1,006 | -1,467 | -77 | -431 | 3,802 | 3,130 |
| 2012 | 4,852 | 2,445 | 3,402 | 2,508 | 2,072 | 2,220 | 2,783 | 4,139 | 4,705 | 5,762 | 2,256 | -269 |
| 2013 | -2,523 | -3,421 | -6,221 | -2,531 | 537 | 892 | 1,473 | 1,528 | 1,179 | 1,427 | 3,302 | 2,378 |
| 2014 | 1,354 | 1,316 | 406 | 2,508 | 2,492 | 3,259 | 2,209 | 766 | 334 | 1,671 | -890 | -820 |
| 2015 | 1,531 | 4,381 | 5,434 | 3,162 | 4,354 | 4,060 | 3,347 | 2,364 | 2,152 | 2,342 | 3,520 | 3,415 |
| 2016 | -1,181 | 1,994 | 1,746 | 2,297 | 2,751 | 1,440 | 1,295 | -131 | -272 | 2,909 | 6,165 | 3,891 |
| 2017 | 3,457 | 1,010 | 3,509 | 6,227 | 954 | 1,109 | 1,452 | 626 | 1,536 | -5,207 | -2,351 | -3,930 |
| 2018 | -2,646 | -7,138 | -10,311 | -11,812 | -2,866 | -2,368 | -5,267 | -2,185 | -3,485 | -1,227 | -7,012 | -2,741 |
| 2019 | -3,456 | -1,471 | 1,832 | 2,439 | -4,053 | -1,725 | 1,204 | 4,155 | 5,753 | 2,879 | 4,893 | 8,233 |
| 2020 | 9,645 | 7,516 | 6,321 | 8,065 | 11,329 | 10,138 | 10,071 | 6,577 | 6,618 | 3,409 | 7,123 | 3,779 |
| 2021 | 1,199 | -359 | 511 | -674 | 403 | -1,192 | -2,413 | -4,429 | -4,056 | 1,826 | -2,671 | -219 |
| 2022 | -815 | 1,409 | 2,503 | -1,306 | -2,770 | -4,025 | -6,550 | -4,646 | -2,185 | 796 | 1,851 | 881 |
| 2023 | 2,116 | 2,952 | -1,895 | 3,298 | 6,006 | 8,677 | 9,730 | 10,197 | 7,371 | 4,038 | 2,246 | 6,545 |
| 2024 | 7,164 | 7,636 | 5,242 | 3,192 | 1,083 | 321 | 1,163 | -378 | -2,463 | -2,059 | -1,346 | -521 |
| 2025 | -5,314 | -3,810 | 4,637 | 3,282 | 2,022 | 946 | 2,366 | -9,648 | -9,194 | -10,358 | -10,121 | -13,438 |
| 2026 | -8,241 | -3,442 | -1,630 | -8,590 | ||||||||
| - = No Data Reported; -- = Not Applicable; NA = Not Available; W = Withheld to avoid disclosure of individual company data. |
| Release Date: 6/30/2026 |
| Next Release Date: 7/31/2026 |