|
Download Data (XLS File) |
|
|||||
|
|||||
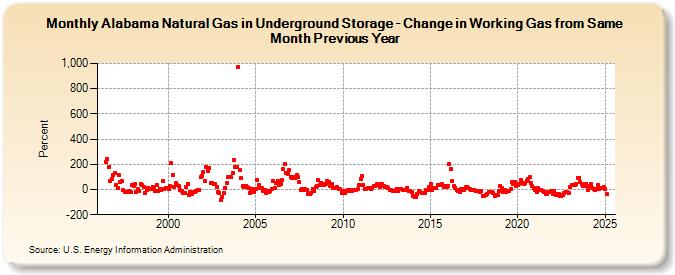
| Alabama Natural Gas in Underground Storage - Change in Working Gas from Same Month Previous Year (Percent) | |||||
| Year | Jan | Feb | Mar | Apr | May | Jun | Jul | Aug | Sep | Oct | Nov | Dec |
|---|---|---|---|---|---|---|---|---|---|---|---|---|
| 1996 | 221.1 | 244.8 | 179.6 | 64.8 | 86.8 | 112.2 | 130.5 | |||||
| 1997 | 36.2 | 10.9 | 111.7 | 57.1 | 68.4 | -5.0 | -17.0 | -19.4 | -19.9 | -12.1 | -19.0 | 36.2 |
| 1998 | 31.5 | 45.0 | -21.4 | 4.3 | -12.4 | 46.2 | 38.7 | 23.0 | -24.8 | -0.8 | 15.1 | 6.0 |
| 1999 | 3.8 | 17.6 | 11.5 | -11.9 | 35.3 | -11.6 | 6.5 | -2.0 | 67.7 | 4.7 | 12.2 | 10.2 |
| 2000 | 7.9 | 25.4 | 213.4 | 116.8 | 22.2 | 51.5 | 32.4 | 25.3 | -6.9 | -10.7 | -27.1 | -24.2 |
| 2001 | 17.9 | 46.2 | -44.2 | -23.4 | -32.8 | -23.0 | -18.6 | -12.6 | -6.3 | -5.4 | 97.8 | 111.1 |
| 2002 | 138.8 | 68.1 | 181.5 | 147.4 | 173.3 | 50.0 | 51.2 | 46.8 | 45.2 | 20.3 | -20.4 | -25.7 |
| 2003 | -86.5 | -57.0 | -25.7 | 14.4 | 54.1 | 99.5 | 100.8 | 98.7 | 129.2 | 237.3 | 177.3 | 180.6 |
| 2004 | 975.0 | 156.9 | 87.4 | 26.5 | 21.6 | 26.2 | 16.2 | 8.1 | -27.6 | 1.4 | 5.1 | -19.1 |
| 2005 | 2.3 | 76.0 | 34.4 | 15.5 | 8.3 | -13.2 | -5.5 | -30.2 | -9.2 | -15.8 | -13.2 | 4.6 |
| 2006 | 64.6 | 13.5 | 53.0 | 67.7 | 36.3 | 43.8 | 72.3 | 161.5 | 204.9 | 129.8 | 122.7 | 158.5 |
| 2007 | 96.3 | 89.3 | 97.9 | 87.5 | 113.0 | 99.7 | 58.9 | -3.8 | 1.8 | -4.3 | 1.9 | -0.1 |
| 2008 | -37.4 | -37.8 | -29.7 | 4.6 | -10.1 | 20.8 | 25.2 | 72.9 | 33.2 | 55.3 | 46.5 | 34.3 |
| 2009 | 42.3 | 67.4 | 62.0 | 28.2 | 44.3 | 13.7 | 8.1 | 11.3 | 17.2 | 0.4 | 2.6 | -25.7 |
| 2010 | -14.4 | -24.9 | -12.0 | -7.7 | -8.9 | -7.3 | -7.9 | -2.5 | -3.5 | -2.1 | 1.5 | 35.0 |
| 2011 | 85.1 | 109.4 | 37.5 | 4.4 | 3.0 | 9.3 | 10.9 | 5.6 | 15.1 | 29.6 | 25.6 | 42.4 |
| 2012 | 36.1 | 23.6 | 40.6 | 41.8 | 25.9 | 16.7 | 18.0 | 10.6 | -6.4 | -1.0 | -12.1 | -11.5 |
| 2013 | -5.1 | 7.7 | -8.6 | 0.6 | 5.0 | -4.8 | -4.2 | -0.2 | 15.5 | -12.0 | -10.0 | -22.7 |
| 2014 | -50.1 | -61.9 | -60.6 | -38.5 | -15.5 | -22.6 | -24.3 | -24.4 | -25.4 | -6.1 | -4.6 | 18.0 |
| 2015 | 44.8 | -6.2 | 9.0 | 12.4 | 12.1 | 32.0 | 37.9 | 35.4 | 44.1 | 21.9 | 30.5 | 23.0 |
| 2016 | 30.1 | 199.5 | 163.9 | 67.0 | 26.8 | 15.0 | -4.6 | -10.7 | -17.5 | 4.0 | 7.7 | -7.4 |
| 2017 | 16.1 | 17.0 | 8.4 | 2.1 | -4.9 | -1.0 | -2.5 | -10.3 | -10.2 | -15.1 | -17.4 | -15.6 |
| 2018 | -49.0 | -54.7 | -42.3 | -33.7 | -18.2 | -21.6 | -22.7 | -24.4 | -48.9 | -41.3 | -42.1 | -13.9 |
| 2019 | 31.1 | 11.8 | -18.2 | -4.0 | -16.3 | -11.5 | -7.9 | 0.5 | 56.2 | 40.4 | 58.8 | 28.1 |
| 2020 | 34.8 | 42.6 | 76.0 | 52.5 | 46.8 | 48.6 | 68.1 | 86.8 | 96.3 | 48.0 | 27.8 | 8.2 |
| 2021 | -2.0 | -22.1 | 8.2 | -6.0 | -4.9 | -11.3 | -23.1 | -34.7 | -37.6 | -18.4 | -16.9 | -10.6 |
| 2022 | -35.2 | -12.4 | -41.2 | -31.9 | -33.5 | -48.9 | -49.0 | -41.7 | -26.6 | -16.6 | -18.1 | -30.4 |
| 2023 | 16.2 | 32.8 | 35.2 | 34.0 | 40.4 | 92.7 | 94.0 | 59.4 | 45.4 | 25.9 | 29.5 | 45.8 |
| 2024 | -1.7 | 31.4 | 47.5 | 14.7 | 4.7 | -4.5 | 3.7 | 33.6 | 1.9 | 10.8 | 14.5 | 21.7 |
| 2025 | 0.9 | -37.8 | -14.9 | 6.4 | 20.3 | 17.8 | -8.5 | 4.9 | 24.9 | 11.7 | 4.0 | -6.7 |
| 2026 | -9.7 | -9.1 | -15.3 | -6.4 | ||||||||
| - = No Data Reported; -- = Not Applicable; NA = Not Available; W = Withheld to avoid disclosure of individual company data. |
| Release Date: 6/30/2026 |
| Next Release Date: 7/31/2026 |