|
Download Data (XLS File) |
|
|||||
|
|||||
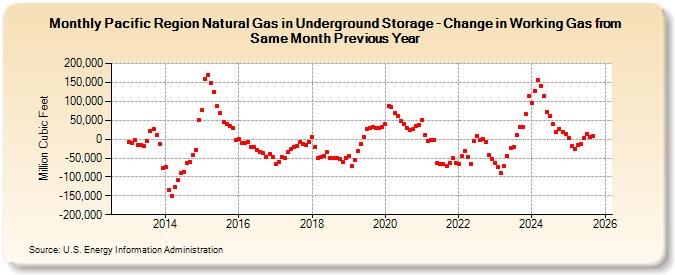
| Pacific Region Natural Gas in Underground Storage - Change in Working Gas from Same Month Previous Year (Million Cubic Feet) | |||||
| Year | Jan | Feb | Mar | Apr | May | Jun | Jul | Aug | Sep | Oct | Nov | Dec |
|---|---|---|---|---|---|---|---|---|---|---|---|---|
| 2013 | -6,428 | -10,631 | -3,098 | -14,687 | -15,553 | -18,935 | -5,226 | 21,508 | 26,741 | 10,233 | -13,013 | -77,412 |
| 2014 | -73,745 | -134,228 | -151,370 | -126,913 | -108,676 | -88,833 | -85,846 | -63,506 | -59,951 | -41,003 | -28,478 | 51,746 |
| 2015 | 78,024 | 157,916 | 170,736 | 149,288 | 125,002 | 86,799 | 69,490 | 45,075 | 40,921 | 33,861 | 29,674 | -2,781 |
| 2016 | 219 | -10,585 | -9,885 | -6,564 | -19,775 | -20,205 | -28,051 | -33,302 | -37,503 | -48,283 | -40,446 | -48,304 |
| 2017 | -66,389 | -61,689 | -46,846 | -48,978 | -35,441 | -27,412 | -20,748 | -17,328 | -7,540 | -13,468 | -16,929 | -7,004 |
| 2018 | 6,549 | -19,591 | -50,073 | -47,999 | -43,948 | -35,131 | -51,228 | -51,129 | -50,895 | -53,667 | -59,470 | -50,258 |
| 2019 | -45,428 | -70,528 | -54,359 | -31,577 | -11,917 | 5,469 | 27,463 | 30,253 | 31,113 | 28,257 | 30,552 | 30,741 |
| 2020 | 38,974 | 88,309 | 85,934 | 68,664 | 61,947 | 48,923 | 39,202 | 30,317 | 24,341 | 27,445 | 33,358 | 37,329 |
| 2021 | 49,540 | 10,106 | -3,948 | -3,083 | -2,065 | -61,984 | -66,951 | -64,567 | -70,862 | -62,521 | -49,576 | -63,959 |
| 2022 | -65,670 | -45,982 | -31,651 | -46,626 | -66,976 | -6,113 | 9,021 | -1,889 | -168 | -7,270 | -42,120 | -51,458 |
| 2023 | -62,878 | -72,966 | -90,663 | -72,382 | -45,981 | -23,984 | -21,570 | 11,213 | 30,876 | 32,414 | 65,411 | 113,272 |
| 2024 | 95,867 | 128,517 | 156,404 | 141,344 | 112,847 | 70,883 | 60,139 | 38,705 | 17,444 | 27,552 | 19,273 | 14,773 |
| 2025 | 3,396 | -19,431 | -25,407 | -15,807 | -12,896 | 2,338 | 13,693 | 5,623 | 7,287 | 7,444 | 4,466 | 9,120 |
| 2026 | 41,871 | 58,526 | 54,310 | 44,095 | ||||||||
| - = No Data Reported; -- = Not Applicable; NA = Not Available; W = Withheld to avoid disclosure of individual company data. |
| Release Date: 6/30/2026 |
| Next Release Date: 7/31/2026 |