|
Download Data (XLS File) |
|
|||||
|
|||||
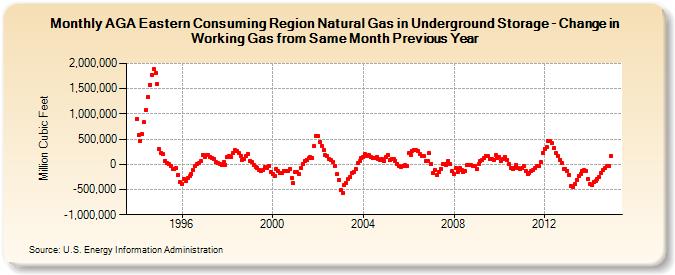
| AGA Eastern Consuming Region Natural Gas in Underground Storage - Change in Working Gas from Same Month Previous Year (Million Cubic Feet) | |||||
| Year | Jan | Feb | Mar | Apr | May | Jun | Jul | Aug | Sep | Oct | Nov | Dec |
|---|---|---|---|---|---|---|---|---|---|---|---|---|
| 1994 | 905,018 | 584,386 | 467,210 | 599,207 | 831,273 | 1,086,355 | 1,342,894 | 1,578,648 | 1,775,994 | 1,885,465 | 1,819,517 | 1,589,500 |
| 1995 | 301,098 | 230,240 | 196,675 | 75,216 | 19,017 | -596 | -42,455 | -91,460 | -85,538 | -74,452 | -211,340 | -356,599 |
| 1996 | -393,813 | -294,573 | -322,708 | -276,653 | -237,719 | -195,517 | -107,487 | -30,832 | 5,418 | 27,829 | 56,363 | 190,892 |
| 1997 | 151,925 | 190,812 | 179,512 | 141,118 | 121,384 | 95,560 | 38,018 | 18,500 | 6,728 | -22,132 | 41,987 | -7,213 |
| 1998 | 141,659 | 165,790 | 146,881 | 232,098 | 280,479 | 261,197 | 229,504 | 167,031 | 91,649 | 98,416 | 168,658 | 213,013 |
| 1999 | 70,617 | 38,320 | -9,509 | -50,129 | -74,612 | -105,750 | -133,041 | -117,460 | -57,319 | -69,702 | -31,326 | -146,632 |
| 2000 | -200,868 | -226,341 | -91,612 | -142,088 | -178,294 | -176,356 | -126,649 | -137,517 | -140,499 | -96,047 | -270,810 | -378,615 |
| 2001 | -159,630 | -150,172 | -192,978 | -70,257 | 15,720 | 71,091 | 93,132 | 115,955 | 135,053 | 126,537 | 353,813 | 567,637 |
| 2002 | 553,669 | 442,511 | 368,838 | 279,545 | 179,924 | 159,192 | 102,425 | 78,067 | 42,148 | -40,760 | -196,681 | -303,176 |
| 2003 | -519,282 | -565,158 | -416,418 | -374,766 | -293,180 | -243,473 | -172,800 | -144,180 | -90,370 | 19,375 | 58,244 | 117,458 |
| 2004 | 136,764 | 195,811 | 160,389 | 175,591 | 144,195 | 115,324 | 119,645 | 136,833 | 107,288 | 79,485 | 98,058 | 65,606 |
| 2005 | 146,070 | 179,661 | 79,057 | 100,408 | 109,276 | 73,388 | 13,138 | -34,110 | -51,538 | -39,338 | -18,817 | -41,525 |
| 2006 | 215,232 | 191,874 | 262,086 | 285,531 | 277,606 | 260,573 | 201,053 | 168,941 | 161,604 | 65,013 | 65,448 | 214,704 |
| 2007 | 9,415 | -169,293 | -113,517 | -211,692 | -155,415 | -92,312 | 470 | 3,489 | -4,735 | 70,339 | 2,913 | -140,039 |
| 2008 | -186,837 | -73,995 | -144,153 | -69,398 | -120,167 | -155,230 | -136,934 | -19,722 | -11,101 | -23,256 | -30,071 | -34,630 |
| 2009 | -90,389 | 15,028 | 70,041 | 78,150 | 124,053 | 165,489 | 164,551 | 108,004 | 100,600 | 87,104 | 175,412 | 132,999 |
| 2010 | 148,142 | 67,443 | 100,883 | 148,891 | 81,753 | 7,519 | -73,545 | -100,200 | -74,312 | -4,810 | -65,532 | -93,836 |
| 2011 | -73,479 | -41,027 | -126,529 | -190,413 | -179,455 | -142,308 | -112,790 | -76,760 | -36,057 | -26,836 | 42,022 | 231,023 |
| 2012 | 308,568 | 336,402 | 468,028 | 454,915 | 415,497 | 324,260 | 227,914 | 163,212 | 90,944 | 24,992 | -90,946 | -89,485 |
| 2013 | -126,954 | -208,325 | -425,435 | -445,564 | -397,450 | -303,387 | -228,796 | -183,324 | -134,947 | -114,129 | -123,294 | -286,963 |
| 2014 | -396,327 | -403,405 | -345,131 | -338,428 | -296,127 | -255,587 | -178,846 | -116,843 | -80,789 | -24,182 | -31,850 | 161,760 |
| - = No Data Reported; -- = Not Applicable; NA = Not Available; W = Withheld to avoid disclosure of individual company data. |
| Release Date: 6/30/2026 |
| Next Release Date: 7/31/2026 |