|
Download Data (XLS File) |
|
|||||
|
|||||
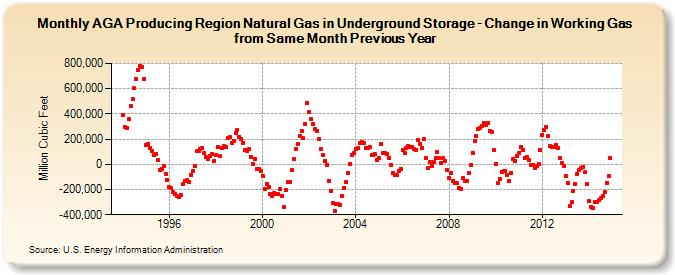
| AGA Producing Region Natural Gas in Underground Storage - Change in Working Gas from Same Month Previous Year (Million Cubic Feet) | |||||
| Year | Jan | Feb | Mar | Apr | May | Jun | Jul | Aug | Sep | Oct | Nov | Dec |
|---|---|---|---|---|---|---|---|---|---|---|---|---|
| 1994 | 393,598 | 297,240 | 289,617 | 356,360 | 461,202 | 516,155 | 604,504 | 678,168 | 747,928 | 783,414 | 775,741 | 673,670 |
| 1995 | 156,161 | 158,351 | 126,677 | 101,609 | 72,294 | 83,427 | 33,855 | -43,870 | -34,609 | -17,003 | -75,285 | -121,212 |
| 1996 | -180,213 | -191,939 | -220,847 | -233,967 | -253,766 | -260,320 | -246,398 | -159,895 | -134,327 | -127,911 | -138,359 | -86,091 |
| 1997 | -55,406 | -14,740 | 101,915 | 102,564 | 121,784 | 132,561 | 86,965 | 58,580 | 38,741 | 67,379 | 80,157 | 28,119 |
| 1998 | 77,255 | 135,784 | 65,355 | 130,979 | 148,718 | 138,540 | 205,160 | 215,060 | 166,834 | 187,302 | 246,104 | 273,754 |
| 1999 | 220,584 | 200,763 | 167,893 | 110,762 | 103,265 | 117,707 | 60,222 | 2,419 | 41,926 | -34,345 | -39,346 | -49,725 |
| 2000 | -90,348 | -193,147 | -152,696 | -177,619 | -235,999 | -252,804 | -231,576 | -232,784 | -238,335 | -195,869 | -250,393 | -338,013 |
| 2001 | -202,062 | -138,163 | -141,238 | -49,027 | 40,270 | 117,497 | 160,927 | 221,381 | 265,012 | 205,812 | 317,658 | 487,230 |
| 2002 | 414,233 | 358,526 | 318,133 | 276,876 | 268,051 | 203,235 | 122,680 | 75,994 | 25,537 | -4,222 | -132,463 | -208,018 |
| 2003 | -310,421 | -374,222 | -318,157 | -315,247 | -319,736 | -254,218 | -187,394 | -142,813 | -71,516 | 4,101 | 75,383 | 88,597 |
| 2004 | 124,061 | 126,898 | 166,523 | 179,932 | 168,097 | 125,455 | 128,246 | 140,976 | 73,009 | 70,125 | 79,317 | 32,757 |
| 2005 | 51,495 | 164,587 | 92,845 | 91,339 | 83,011 | 49,545 | -4,464 | -66,204 | -81,634 | -86,750 | -56,243 | -34,841 |
| 2006 | 112,675 | 88,497 | 131,260 | 141,963 | 135,765 | 139,739 | 117,857 | 112,317 | 190,503 | 163,773 | 125,635 | 204,252 |
| 2007 | 49,791 | -26,269 | 22,190 | -14,367 | 21,512 | 48,635 | 95,302 | 49,193 | 8,688 | 47,839 | 28,298 | -43,632 |
| 2008 | -108,732 | -70,856 | -130,697 | -147,097 | -151,333 | -187,371 | -198,342 | -112,014 | -136,223 | -136,355 | -70,628 | -7,873 |
| 2009 | 92,621 | 182,469 | 221,512 | 278,519 | 287,189 | 300,080 | 328,857 | 311,200 | 325,290 | 265,283 | 258,211 | 111,937 |
| 2010 | 5,507 | -144,444 | -115,510 | -57,256 | -53,508 | -50,091 | -88,392 | -128,608 | -68,939 | 43,154 | 29,701 | 68,463 |
| 2011 | 93,648 | 134,265 | 112,298 | 53,322 | 55,535 | 31,594 | -2,842 | -5,807 | -28,444 | -10,646 | 2,546 | 111,633 |
| 2012 | 230,617 | 268,471 | 299,473 | 225,774 | 143,846 | 134,784 | 139,889 | 155,197 | 131,092 | 50,193 | 9,696 | -15,286 |
| 2013 | -93,986 | -150,325 | -332,353 | -299,143 | -209,952 | -154,221 | -79,328 | -41,716 | -28,340 | -17,497 | -64,851 | -154,422 |
| 2014 | -292,422 | -338,734 | -343,203 | -302,933 | -300,082 | -282,346 | -263,547 | -251,084 | -220,846 | -145,908 | -95,480 | 47,073 |
| - = No Data Reported; -- = Not Applicable; NA = Not Available; W = Withheld to avoid disclosure of individual company data. |
| Release Date: 6/30/2026 |
| Next Release Date: 7/31/2026 |