|
Download Data (XLS File) |
|
|||||
|
|||||
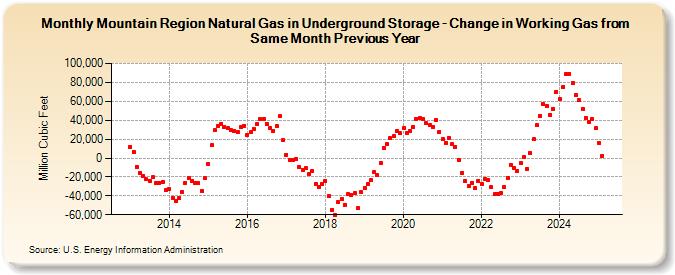
| Mountain Region Natural Gas in Underground Storage - Change in Working Gas from Same Month Previous Year (Million Cubic Feet) | |||||
| Year | Jan | Feb | Mar | Apr | May | Jun | Jul | Aug | Sep | Oct | Nov | Dec |
|---|---|---|---|---|---|---|---|---|---|---|---|---|
| 2013 | 12,014 | 6,758 | -9,151 | -16,380 | -18,695 | -22,708 | -24,019 | -20,476 | -26,134 | -26,039 | -24,866 | -34,136 |
| 2014 | -32,861 | -42,199 | -45,053 | -42,581 | -35,771 | -26,278 | -21,654 | -24,388 | -26,437 | -26,669 | -34,817 | -21,557 |
| 2015 | -6,412 | 13,374 | 29,357 | 34,073 | 36,475 | 32,988 | 31,353 | 29,400 | 28,615 | 27,317 | 32,540 | 33,887 |
| 2016 | 24,652 | 27,247 | 30,716 | 35,606 | 41,058 | 41,402 | 36,173 | 31,682 | 28,991 | 33,417 | 43,931 | 18,707 |
| 2017 | 3,582 | -2,604 | -2,403 | -735 | -9,550 | -12,172 | -10,596 | -17,116 | -13,836 | -27,489 | -30,614 | -27,505 |
| 2018 | -24,149 | -39,797 | -54,661 | -59,855 | -46,794 | -43,851 | -49,340 | -38,207 | -38,997 | -37,529 | -52,753 | -35,471 |
| 2019 | -31,580 | -27,596 | -23,653 | -14,710 | -18,087 | -4,850 | 10,732 | 14,447 | 21,102 | 23,147 | 28,416 | 25,940 |
| 2020 | 31,526 | 26,255 | 28,534 | 33,058 | 41,565 | 41,914 | 41,426 | 36,861 | 34,608 | 33,189 | 40,060 | 27,731 |
| 2021 | 19,866 | 15,720 | 21,553 | 14,388 | 11,444 | -1,993 | -15,663 | -24,375 | -29,872 | -26,110 | -31,959 | -23,849 |
| 2022 | -26,999 | -22,283 | -23,056 | -30,893 | -38,274 | -38,050 | -37,100 | -30,951 | -20,945 | -7,285 | -10,068 | -13,749 |
| 2023 | -5,083 | 860 | -11,117 | 5,130 | 19,806 | 34,473 | 44,710 | 56,993 | 55,206 | 45,834 | 52,200 | 70,044 |
| 2024 | 62,236 | 75,057 | 88,560 | 88,931 | 79,139 | 66,486 | 61,301 | 51,710 | 42,683 | 37,987 | 40,859 | 31,214 |
| 2025 | 16,182 | 2,203 | 1,956 | -6,129 | -6,573 | -6,049 | -3,799 | -20,330 | -16,105 | -10,826 | -11,180 | -9,067 |
| 2026 | 2,999 | 18,918 | 28,024 | 22,636 | ||||||||
| - = No Data Reported; -- = Not Applicable; NA = Not Available; W = Withheld to avoid disclosure of individual company data. |
| Release Date: 6/30/2026 |
| Next Release Date: 7/31/2026 |