|
Download Data (XLS File) |
|
|||||
|
|||||
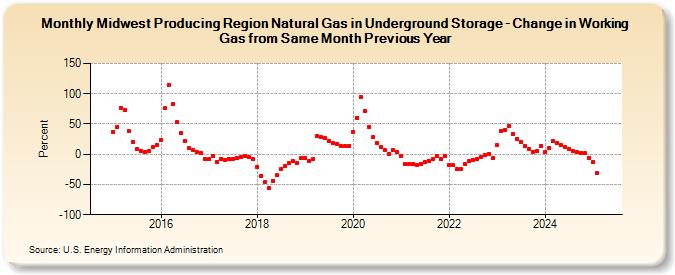
| Midwest Producing Region Natural Gas in Underground Storage - Change in Working Gas from Same Month Previous Year (Percent) | |||||
| Year | Jan | Feb | Mar | Apr | May | Jun | Jul | Aug | Sep | Oct | Nov | Dec |
|---|---|---|---|---|---|---|---|---|---|---|---|---|
| 2015 | 37.50 | 45.20 | 77.20 | 72.70 | 38.10 | 19.90 | 9.40 | 5.50 | 4.00 | 4.60 | 12.20 | 15.70 |
| 2016 | 23.70 | 75.90 | 115.20 | 82.90 | 53.00 | 34.90 | 21.80 | 10.60 | 7.10 | 3.50 | 1.90 | -8.40 |
| 2017 | -8.70 | -3.20 | -12.20 | -7.40 | -9.30 | -8.20 | -8.40 | -5.70 | -4.70 | -2.90 | -5.20 | -8.50 |
| 2018 | -20.70 | -35.30 | -45.20 | -55.20 | -43.60 | -34.60 | -25.20 | -18.80 | -14.80 | -11.70 | -13.90 | -6.20 |
| 2019 | -5.80 | -11.50 | -7.50 | 29.90 | 27.90 | 26.30 | 21.90 | 18.40 | 17.00 | 13.50 | 13.50 | 13.90 |
| 2020 | 37.50 | 60.50 | 94.90 | 71.50 | 45.80 | 28.90 | 18.80 | 12.00 | 6.30 | 0.90 | 7.60 | 3.70 |
| 2021 | -3.40 | -16.20 | -16.10 | -16.30 | -17.00 | -15.70 | -12.90 | -11.50 | -8.30 | -3.40 | -7.70 | -3.40 |
| 2022 | -17.00 | -17.90 | -25.10 | -24.60 | -16.40 | -11.50 | -10.00 | -7.30 | -5.10 | -2.00 | 0.70 | -6.20 |
| 2023 | 14.80 | 39.20 | 40.70 | 46.90 | 34.00 | 25.80 | 20.30 | 13.50 | 8.30 | 4.20 | 4.50 | 14.10 |
| 2024 | 4.40 | 10.40 | 21.80 | 19.30 | 15.20 | 11.50 | 8.30 | 5.80 | 2.90 | 1.60 | 1.80 | -5.90 |
| 2025 | -13.20 | -31.30 | -28.10 | -23.20 | -15.30 | -11.50 | -9.20 | -6.00 | -3.40 | -1.60 | -2.60 | -7.20 |
| 2026 | -6.70 | -1.00 | -3.90 | -0.10 | ||||||||
| - = No Data Reported; -- = Not Applicable; NA = Not Available; W = Withheld to avoid disclosure of individual company data. |
| Release Date: 6/30/2026 |
| Next Release Date: 7/31/2026 |