|
Download Data (XLS File) |
|
|||||
|
|||||
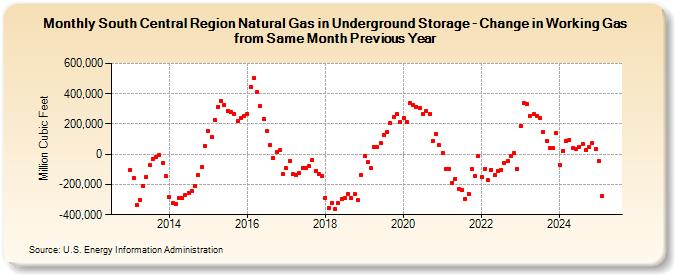
| South Central Region Natural Gas in Underground Storage - Change in Working Gas from Same Month Previous Year (Million Cubic Feet) | |||||
| Year | Jan | Feb | Mar | Apr | May | Jun | Jul | Aug | Sep | Oct | Nov | Dec |
|---|---|---|---|---|---|---|---|---|---|---|---|---|
| 2013 | -101,888 | -155,544 | -335,881 | -301,038 | -208,037 | -149,650 | -71,958 | -32,654 | -17,109 | -7,023 | -55,429 | -144,477 |
| 2014 | -281,823 | -324,789 | -326,968 | -286,719 | -287,056 | -272,324 | -254,513 | -242,345 | -212,206 | -137,887 | -86,360 | 54,089 |
| 2015 | 154,908 | 114,724 | 228,667 | 314,012 | 351,246 | 326,953 | 286,153 | 281,126 | 269,012 | 222,396 | 239,671 | 250,561 |
| 2016 | 265,988 | 446,975 | 505,018 | 409,475 | 315,807 | 233,669 | 151,264 | 61,447 | -22,206 | 11,854 | 27,744 | -133,484 |
| 2017 | -92,832 | -42,467 | -133,457 | -135,950 | -125,199 | -87,981 | -91,456 | -80,604 | -38,397 | -110,487 | -133,118 | -145,868 |
| 2018 | -287,394 | -357,013 | -324,617 | -365,336 | -324,329 | -293,437 | -288,101 | -266,323 | -292,055 | -266,034 | -304,777 | -136,697 |
| 2019 | -12,688 | -52,436 | -94,159 | 46,039 | 47,715 | 72,037 | 128,288 | 146,729 | 203,688 | 243,468 | 266,514 | 215,338 |
| 2020 | 238,028 | 215,428 | 337,952 | 326,946 | 314,632 | 303,972 | 265,252 | 284,562 | 263,616 | 89,170 | 132,226 | 60,451 |
| 2021 | 10,026 | -98,556 | -96,848 | -189,712 | -161,504 | -227,863 | -233,909 | -293,834 | -259,935 | -96,270 | -143,501 | -12,469 |
| 2022 | -151,049 | -98,809 | -172,790 | -101,250 | -138,164 | -108,558 | -101,418 | -55,567 | -46,459 | -14,655 | 9,644 | -100,699 |
| 2023 | 186,562 | 339,096 | 331,547 | 252,140 | 243,254 | 252,883 | 236,244 | 148,128 | 86,001 | 39,208 | 40,630 | 140,576 |
| 2024 | -68,366 | 23,120 | 88,428 | 94,391 | 59,409 | 34,170 | 46,775 | 64,015 | 28,332 | 48,733 | 72,094 | 32,509 |
| 2025 | -49,222 | -282,366 | -231,919 | -177,424 | -94,048 | -34,739 | -19,402 | 31,869 | 60,008 | 28,201 | 39,171 | -33,374 |
| 2026 | -6,657 | 56,871 | 19,830 | -2,645 | ||||||||
| - = No Data Reported; -- = Not Applicable; NA = Not Available; W = Withheld to avoid disclosure of individual company data. |
| Release Date: 6/30/2026 |
| Next Release Date: 7/31/2026 |