|
Download Data (XLS File) |
|
|||||
|
|||||
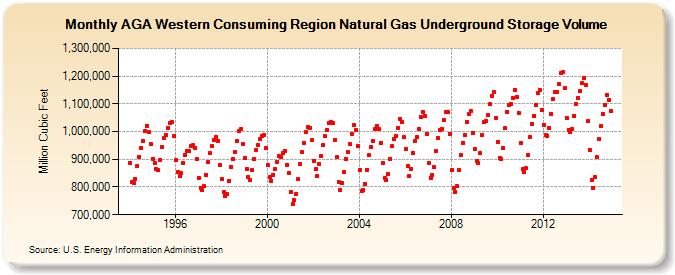
| AGA Western Consuming Region Natural Gas Underground Storage Volume (Million Cubic Feet) | |||||
| Year | Jan | Feb | Mar | Apr | May | Jun | Jul | Aug | Sep | Oct | Nov | Dec |
|---|---|---|---|---|---|---|---|---|---|---|---|---|
| 1994 | 888,010 | 816,597 | 813,746 | 830,132 | 876,457 | 908,444 | 941,985 | 966,686 | 1,002,402 | 1,021,144 | 997,644 | 956,234 |
| 1995 | 902,782 | 884,830 | 865,309 | 860,012 | 897,991 | 945,183 | 975,307 | 986,131 | 1,011,948 | 1,032,357 | 1,033,363 | 982,781 |
| 1996 | 896,744 | 853,207 | 837,980 | 849,221 | 885,715 | 916,778 | 929,559 | 928,785 | 946,748 | 949,983 | 939,649 | 899,689 |
| 1997 | 833,239 | 796,139 | 788,601 | 801,955 | 844,880 | 890,703 | 923,845 | 947,277 | 969,170 | 980,388 | 967,286 | 880,627 |
| 1998 | 828,658 | 780,476 | 768,264 | 773,053 | 823,311 | 872,913 | 900,181 | 925,287 | 965,846 | 1,001,548 | 1,009,978 | 953,379 |
| 1999 | 903,937 | 865,064 | 837,335 | 826,212 | 859,549 | 899,751 | 935,150 | 951,200 | 974,891 | 984,403 | 987,727 | 938,993 |
| 2000 | 878,578 | 836,428 | 822,760 | 844,962 | 866,578 | 891,149 | 910,813 | 907,441 | 921,462 | 931,030 | 880,544 | 849,106 |
| 2001 | 783,739 | 739,302 | 751,284 | 774,906 | 827,397 | 883,852 | 926,890 | 958,928 | 997,141 | 1,014,960 | 1,013,431 | 969,732 |
| 2002 | 894,079 | 863,297 | 839,495 | 883,360 | 912,820 | 950,010 | 982,157 | 1,006,994 | 1,029,218 | 1,034,722 | 1,031,877 | 968,827 |
| 2003 | 906,445 | 819,614 | 790,879 | 812,762 | 852,674 | 902,053 | 927,111 | 954,400 | 992,187 | 1,023,061 | 1,005,124 | 947,676 |
| 2004 | 860,401 | 786,881 | 790,360 | 812,159 | 862,263 | 914,493 | 943,748 | 965,936 | 1,007,659 | 1,020,823 | 1,009,775 | 958,441 |
| 2005 | 885,814 | 831,813 | 824,976 | 847,248 | 902,153 | 946,998 | 971,621 | 983,856 | 1,013,936 | 1,043,866 | 1,036,213 | 980,819 |
| 2006 | 937,048 | 875,275 | 839,273 | 866,552 | 923,724 | 966,002 | 979,930 | 1,007,790 | 1,051,728 | 1,071,765 | 1,056,988 | 991,372 |
| 2007 | 887,328 | 833,695 | 841,847 | 871,341 | 930,988 | 978,299 | 1,004,741 | 1,009,732 | 1,043,453 | 1,070,933 | 1,068,779 | 991,248 |
| 2008 | 860,872 | 796,190 | 781,316 | 801,917 | 860,416 | 914,211 | 960,237 | 986,624 | 1,035,370 | 1,063,819 | 1,072,644 | 994,363 |
| 2009 | 937,677 | 893,749 | 887,570 | 922,976 | 988,635 | 1,036,070 | 1,037,400 | 1,059,823 | 1,098,039 | 1,128,489 | 1,141,692 | 1,050,347 |
| 2010 | 964,016 | 905,387 | 901,801 | 939,454 | 1,012,402 | 1,070,764 | 1,095,243 | 1,100,830 | 1,121,842 | 1,151,370 | 1,126,447 | 1,068,130 |
| 2011 | 959,087 | 863,919 | 853,878 | 867,135 | 917,058 | 979,589 | 1,028,279 | 1,057,333 | 1,097,566 | 1,139,346 | 1,150,782 | 1,077,621 |
| 2012 | 1,025,269 | 987,203 | 983,687 | 1,014,431 | 1,064,918 | 1,116,370 | 1,141,936 | 1,141,305 | 1,170,112 | 1,210,463 | 1,213,095 | 1,157,067 |
| 2013 | 1,050,332 | 1,006,640 | 998,585 | 1,008,767 | 1,057,210 | 1,098,526 | 1,121,152 | 1,145,454 | 1,173,750 | 1,193,462 | 1,168,021 | 1,037,682 |
| 2014 | 934,800 | 823,800 | 796,771 | 835,080 | 906,697 | 974,347 | 1,019,826 | 1,064,981 | 1,095,743 | 1,133,663 | 1,115,253 | 1,074,675 |
| - = No Data Reported; -- = Not Applicable; NA = Not Available; W = Withheld to avoid disclosure of individual company data. |
| Release Date: 6/30/2026 |
| Next Release Date: 7/31/2026 |