|
Download Data (XLS File) |
|
|||||
|
|||||
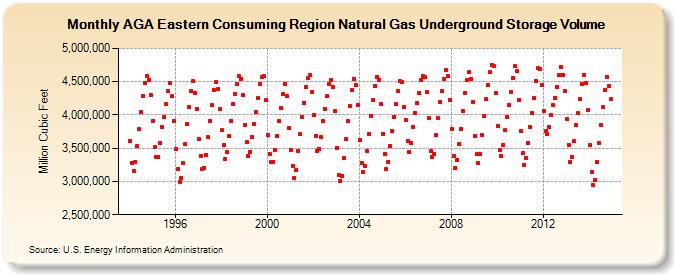
| AGA Eastern Consuming Region Natural Gas Underground Storage Volume (Million Cubic Feet) | |||||
| Year | Jan | Feb | Mar | Apr | May | Jun | Jul | Aug | Sep | Oct | Nov | Dec |
|---|---|---|---|---|---|---|---|---|---|---|---|---|
| 1994 | 3,605,263 | 3,281,694 | 3,164,033 | 3,297,696 | 3,531,074 | 3,786,195 | 4,043,225 | 4,279,875 | 4,477,279 | 4,588,167 | 4,522,088 | 4,292,649 |
| 1995 | 3,905,789 | 3,514,201 | 3,360,765 | 3,369,823 | 3,576,559 | 3,812,014 | 3,968,751 | 4,159,006 | 4,362,855 | 4,483,271 | 4,279,539 | 3,905,710 |
| 1996 | 3,483,209 | 3,190,123 | 2,987,233 | 3,052,606 | 3,272,105 | 3,557,334 | 3,859,973 | 4,122,060 | 4,364,848 | 4,508,821 | 4,334,814 | 4,094,033 |
| 1997 | 3,630,708 | 3,381,047 | 3,190,271 | 3,205,661 | 3,398,322 | 3,660,850 | 3,905,985 | 4,151,456 | 4,379,374 | 4,493,802 | 4,383,068 | 4,084,339 |
| 1998 | 3,774,740 | 3,544,699 | 3,335,505 | 3,436,983 | 3,680,419 | 3,909,517 | 4,166,130 | 4,309,452 | 4,461,762 | 4,580,963 | 4,542,742 | 4,295,021 |
| 1999 | 3,849,645 | 3,586,792 | 3,384,329 | 3,445,967 | 3,666,190 | 3,866,338 | 4,044,569 | 4,250,227 | 4,462,515 | 4,571,590 | 4,579,904 | 4,217,554 |
| 2000 | 3,701,556 | 3,412,687 | 3,290,027 | 3,295,896 | 3,477,772 | 3,678,879 | 3,906,340 | 4,100,444 | 4,310,203 | 4,462,995 | 4,287,123 | 3,809,256 |
| 2001 | 3,477,937 | 3,226,382 | 3,049,081 | 3,176,539 | 3,455,307 | 3,711,021 | 3,966,747 | 4,184,031 | 4,414,795 | 4,551,282 | 4,602,087 | 4,344,827 |
| 2002 | 4,004,984 | 3,687,641 | 3,451,643 | 3,488,995 | 3,665,503 | 3,901,316 | 4,094,604 | 4,287,662 | 4,468,231 | 4,529,633 | 4,426,474 | 4,061,498 |
| 2003 | 3,502,818 | 3,102,613 | 3,010,913 | 3,089,336 | 3,353,198 | 3,640,025 | 3,903,673 | 4,127,758 | 4,375,472 | 4,545,400 | 4,455,744 | 4,150,817 |
| 2004 | 3,621,109 | 3,282,556 | 3,137,352 | 3,232,274 | 3,462,566 | 3,719,208 | 3,990,058 | 4,223,774 | 4,435,442 | 4,577,450 | 4,526,418 | 4,170,075 |
| 2005 | 3,719,482 | 3,418,452 | 3,181,418 | 3,298,371 | 3,535,076 | 3,757,715 | 3,968,194 | 4,158,647 | 4,360,028 | 4,515,555 | 4,489,219 | 4,120,997 |
| 2006 | 3,929,729 | 3,605,034 | 3,440,125 | 3,580,239 | 3,811,570 | 4,029,898 | 4,178,121 | 4,335,796 | 4,530,646 | 4,589,790 | 4,563,744 | 4,351,563 |
| 2007 | 3,956,037 | 3,452,257 | 3,374,640 | 3,413,575 | 3,697,277 | 3,951,190 | 4,192,478 | 4,355,248 | 4,542,873 | 4,677,743 | 4,584,547 | 4,230,765 |
| 2008 | 3,782,466 | 3,383,008 | 3,206,206 | 3,323,827 | 3,561,194 | 3,795,260 | 4,054,193 | 4,331,607 | 4,526,290 | 4,648,303 | 4,544,118 | 4,187,348 |
| 2009 | 3,686,697 | 3,405,150 | 3,282,277 | 3,412,368 | 3,694,012 | 3,976,968 | 4,233,319 | 4,453,895 | 4,640,948 | 4,749,718 | 4,737,940 | 4,322,258 |
| 2010 | 3,835,778 | 3,470,487 | 3,381,912 | 3,555,363 | 3,769,396 | 3,970,045 | 4,147,252 | 4,341,373 | 4,551,325 | 4,730,220 | 4,656,621 | 4,226,040 |
| 2011 | 3,755,541 | 3,422,503 | 3,249,036 | 3,357,177 | 3,582,081 | 3,819,954 | 4,026,374 | 4,256,838 | 4,510,464 | 4,700,148 | 4,694,358 | 4,453,166 |
| 2012 | 4,064,461 | 3,759,205 | 3,718,359 | 3,813,800 | 3,997,855 | 4,145,397 | 4,255,668 | 4,421,310 | 4,602,681 | 4,723,848 | 4,605,511 | 4,366,744 |
| 2013 | 3,940,813 | 3,554,464 | 3,295,165 | 3,369,743 | 3,603,738 | 3,844,444 | 4,025,318 | 4,236,917 | 4,466,596 | 4,606,973 | 4,478,084 | 4,077,162 |
| 2014 | 3,542,596 | 3,148,324 | 2,939,215 | 3,026,766 | 3,297,211 | 3,579,296 | 3,841,204 | 4,114,591 | 4,380,162 | 4,576,950 | 4,440,427 | 4,232,406 |
| - = No Data Reported; -- = Not Applicable; NA = Not Available; W = Withheld to avoid disclosure of individual company data. |
| Release Date: 6/30/2026 |
| Next Release Date: 7/31/2026 |