|
Download Data (XLS File) |
|
|||||
|
|||||
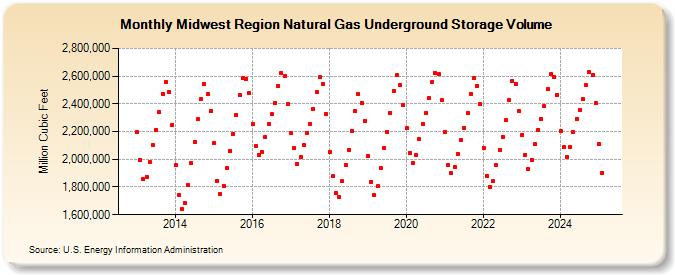
| Midwest Region Natural Gas Underground Storage Volume (Million Cubic Feet) | |||||
| Year | Jan | Feb | Mar | Apr | May | Jun | Jul | Aug | Sep | Oct | Nov | Dec |
|---|---|---|---|---|---|---|---|---|---|---|---|---|
| 2013 | 2,195,944 | 1,997,063 | 1,855,083 | 1,870,840 | 1,978,051 | 2,100,257 | 2,212,914 | 2,340,431 | 2,474,082 | 2,558,479 | 2,487,640 | 2,249,921 |
| 2014 | 1,955,319 | 1,742,978 | 1,640,311 | 1,681,894 | 1,816,029 | 1,970,375 | 2,124,374 | 2,287,540 | 2,434,709 | 2,544,399 | 2,469,652 | 2,351,566 |
| 2015 | 2,115,639 | 1,842,618 | 1,748,917 | 1,805,578 | 1,934,606 | 2,062,641 | 2,181,461 | 2,321,316 | 2,463,235 | 2,583,800 | 2,580,265 | 2,477,168 |
| 2016 | 2,253,236 | 2,096,691 | 2,031,331 | 2,053,911 | 2,159,317 | 2,252,218 | 2,323,119 | 2,409,583 | 2,531,294 | 2,625,280 | 2,603,604 | 2,397,621 |
| 2017 | 2,189,476 | 2,079,782 | 1,968,289 | 2,014,972 | 2,099,832 | 2,192,730 | 2,255,447 | 2,359,964 | 2,484,978 | 2,593,095 | 2,546,461 | 2,326,684 |
| 2018 | 2,052,049 | 1,879,275 | 1,760,185 | 1,730,555 | 1,841,116 | 1,957,599 | 2,070,330 | 2,203,858 | 2,345,691 | 2,471,007 | 2,407,283 | 2,278,286 |
| 2019 | 2,022,525 | 1,838,173 | 1,740,459 | 1,805,099 | 1,939,826 | 2,081,047 | 2,197,943 | 2,337,024 | 2,494,514 | 2,608,113 | 2,535,031 | 2,390,055 |
| 2020 | 2,222,324 | 2,046,314 | 1,976,385 | 2,027,764 | 2,144,987 | 2,252,721 | 2,332,836 | 2,440,432 | 2,558,814 | 2,619,644 | 2,614,354 | 2,424,682 |
| 2021 | 2,199,545 | 1,960,155 | 1,901,408 | 1,944,500 | 2,038,329 | 2,137,140 | 2,227,700 | 2,335,052 | 2,473,867 | 2,584,012 | 2,531,557 | 2,396,059 |
| 2022 | 2,084,410 | 1,880,660 | 1,802,628 | 1,841,326 | 1,955,950 | 2,070,330 | 2,161,640 | 2,280,329 | 2,430,439 | 2,567,519 | 2,544,502 | 2,345,823 |
| 2023 | 2,174,662 | 2,032,735 | 1,929,486 | 1,997,652 | 2,107,495 | 2,213,872 | 2,293,043 | 2,383,541 | 2,505,712 | 2,610,582 | 2,589,792 | 2,461,807 |
| 2024 | 2,202,342 | 2,085,004 | 2,019,897 | 2,090,445 | 2,197,915 | 2,293,877 | 2,357,837 | 2,434,670 | 2,532,564 | 2,626,498 | 2,607,368 | 2,404,120 |
| 2025 | 2,109,079 | 1,903,891 | 1,875,631 | 1,953,915 | 2,090,317 | 2,201,839 | 2,275,079 | 2,374,048 | 2,495,968 | 2,607,318 | 2,576,902 | 2,338,719 |
| 2026 | 2,067,795 | 1,898,574 | 1,859,978 | 1,952,747 | ||||||||
| - = No Data Reported; -- = Not Applicable; NA = Not Available; W = Withheld to avoid disclosure of individual company data. |
| Release Date: 6/30/2026 |
| Next Release Date: 7/31/2026 |